| Red | Green | Blue | |
| z | 17.64 | ||
| znorm | Inf | ||
| sky | -Inf | -Inf | -Inf |
| S/N | 35.5 | 54.2 | 71.4 |
| S/N(c) | 0.0 | 0.0 | 0.0 |
| SN(E/C) |


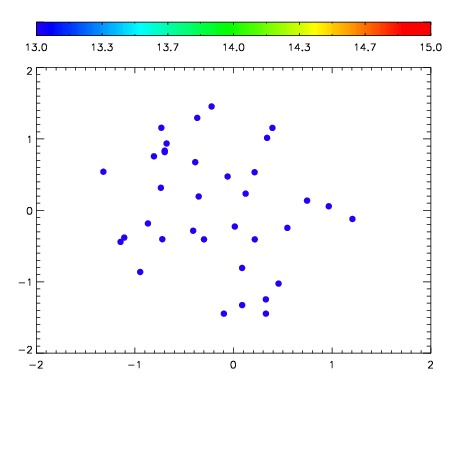

| Frame | Nreads | Zeropoints | Mag plots | Spatial mag deviation | Spatial sky 16325A emission deviations (filled: sky, open: star) | Spatial sky continuum emission | Spatial sky telluric CO2 absorption deviations (filled: H < 10) | |||||||||||||||||||||||
| 0 | 0 |
|
|
|
|
|
|
| IPAIR | NAME | SHIFT | NEWSHIFT | S/N | NAME | SHIFT | NEWSHIFT | S/N |
| 0 | 17870069 | 0.520714 | 0.00000 | 19.2334 | 17870067 | 0.00567161 | 0.515042 | 19.2397 |
| 1 | 17870061 | 0.516034 | 0.00467998 | 19.2321 | 17870066 | 0.00514690 | 0.515567 | 19.2353 |
| 2 | 17870068 | 0.519985 | 0.000728965 | 19.2311 | 17870070 | 0.00672458 | 0.513989 | 19.2293 |
| 3 | 17870065 | 0.518931 | 0.00178301 | 19.2277 | 17870059 | 0.00000 | 0.520714 | 19.2076 |
| 4 | 17870064 | 0.517561 | 0.00315297 | 19.2025 | 17870062 | 0.00397060 | 0.516743 | 19.2041 |
| 5 | 17870060 | 0.515477 | 0.00523698 | 19.1862 | 17870063 | 0.00400991 | 0.516704 | 19.1364 |