| Red | Green | Blue | |
| z | 17.64 | ||
| znorm | Inf | ||
| sky | -Inf | -Inf | -NaN |
| S/N | 19.9 | 40.4 | 41.9 |
| S/N(c) | 0.0 | 0.0 | 0.0 |
| SN(E/C) |
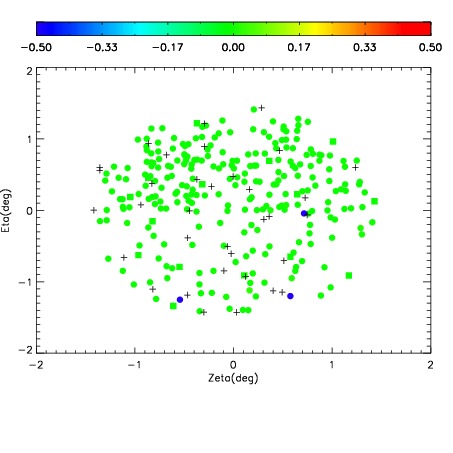
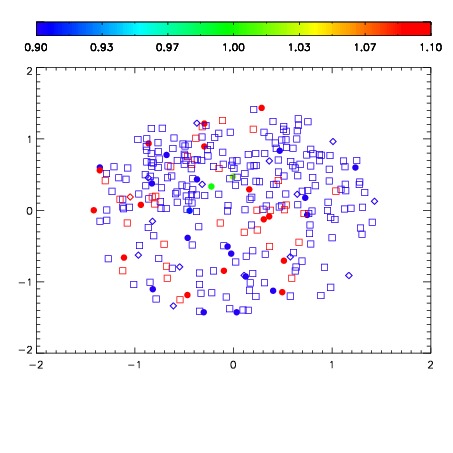
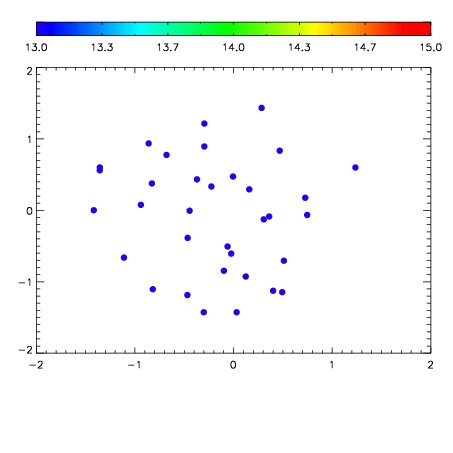

| Frame | Nreads | Zeropoints | Mag plots | Spatial mag deviation | Spatial sky 16325A emission deviations (filled: sky, open: star) | Spatial sky continuum emission | Spatial sky telluric CO2 absorption deviations (filled: H < 10) | |||||||||||||||||||||||
| 0 | 0 |
|
|
|
|
|
|
| IPAIR | NAME | SHIFT | NEWSHIFT | S/N | NAME | SHIFT | NEWSHIFT | S/N |
| 0 | 17940030 | 0.507398 | 0.00000 | 18.8033 | 17940031 | 0.00206291 | 0.505335 | 18.7016 |
| 1 | 17940026 | 0.506785 | 0.000613034 | 18.9115 | 17940032 | 0.00157579 | 0.505822 | 18.9234 |
| 2 | 17940034 | 0.507303 | 9.50098e-05 | 18.9050 | 17940024 | 0.00104056 | 0.506357 | 18.8883 |
| 3 | 17940025 | 0.507150 | 0.000248015 | 18.8851 | 17940028 | 0.00123723 | 0.506161 | 18.8882 |
| 4 | 17940033 | 0.507111 | 0.000286996 | 18.8713 | 17940020 | 0.00000 | 0.507398 | 18.8814 |
| 5 | 17940029 | 0.506915 | 0.000483036 | 18.8642 | 17940027 | 0.00160530 | 0.505793 | 18.8562 |
| 6 | 17940021 | 0.506249 | 0.00114900 | 18.8518 | 17940023 | 0.00154394 | 0.505854 | 18.8276 |
| 7 | 17940022 | 0.507113 | 0.000285029 | 18.8470 | 17940035 | 0.00578647 | 0.501612 | 18.7330 |