| Red | Green | Blue | |
| z | 17.64 | ||
| znorm | Inf | ||
| sky | -Inf | -Inf | -NaN |
| S/N | 14.4 | 30.4 | 31.7 |
| S/N(c) | 0.0 | 0.0 | 0.0 |
| SN(E/C) |
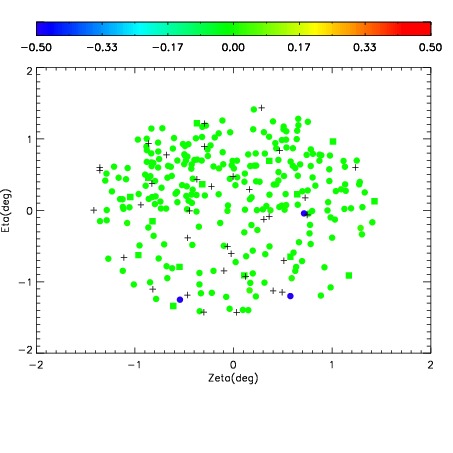
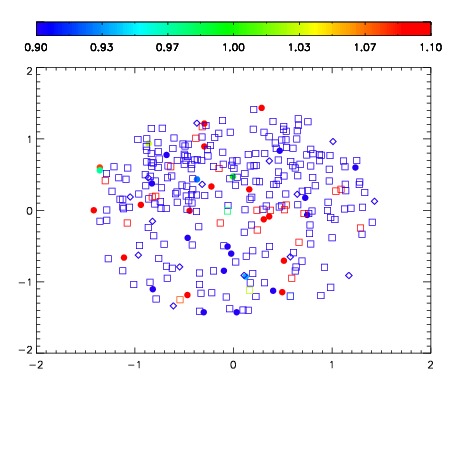
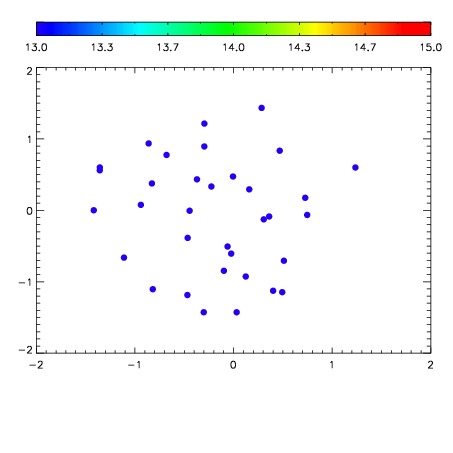

| Frame | Nreads | Zeropoints | Mag plots | Spatial mag deviation | Spatial sky 16325A emission deviations (filled: sky, open: star) | Spatial sky continuum emission | Spatial sky telluric CO2 absorption deviations (filled: H < 10) | |||||||||||||||||||||||
| 0 | 0 |
|
|
|
|
|
|
| IPAIR | NAME | SHIFT | NEWSHIFT | S/N | NAME | SHIFT | NEWSHIFT | S/N |
| 0 | 17950020 | 0.501633 | 0.00000 | 19.0316 | 17950015 | 0.00426506 | 0.497368 | 19.0056 |
| 1 | 17950016 | 0.499731 | 0.00190198 | 19.0776 | 17950018 | 0.00144322 | 0.500190 | 19.0865 |
| 2 | 17950017 | 0.501156 | 0.000477016 | 19.0566 | 17950019 | 0.00158531 | 0.500048 | 19.0146 |
| 3 | 17950012 | 0.499951 | 0.00168198 | 18.9335 | 17950011 | 0.00000 | 0.501633 | 18.9687 |
| 4 | 17950013 | 0.500241 | 0.00139201 | 18.7905 | 17950014 | 0.00516816 | 0.496465 | 18.6290 |