| Red | Green | Blue | |
| z | 17.64 | ||
| znorm | Inf | ||
| sky | -Inf | -Inf | -Inf |
| S/N | 12.9 | 25.3 | 27.0 |
| S/N(c) | 0.0 | 0.0 | 0.0 |
| SN(E/C) |

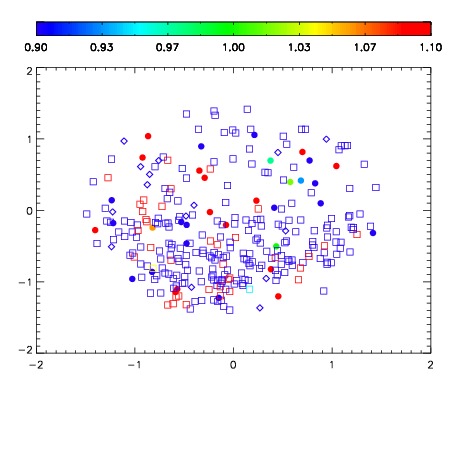
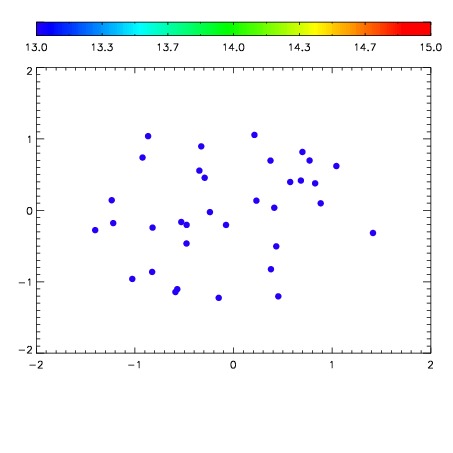

| Frame | Nreads | Zeropoints | Mag plots | Spatial mag deviation | Spatial sky 16325A emission deviations (filled: sky, open: star) | Spatial sky continuum emission | Spatial sky telluric CO2 absorption deviations (filled: H < 10) | |||||||||||||||||||||||
| 0 | 0 |
|
|
|
|
|
|
| IPAIR | NAME | SHIFT | NEWSHIFT | S/N | NAME | SHIFT | NEWSHIFT | S/N |
| 0 | 17830021 | 0.510182 | 0.00000 | 18.2929 | 17830022 | 0.00169833 | 0.508484 | 18.3621 |
| 1 | 17830024 | 0.509661 | 0.000521004 | 18.3757 | 17830023 | 0.00150956 | 0.508672 | 18.4237 |
| 2 | 17830020 | 0.509674 | 0.000508010 | 18.2412 | 17830019 | 0.00000 | 0.510182 | 18.1830 |