| Red | Green | Blue | |
| z | 17.64 | ||
| znorm | Inf | ||
| sky | -Inf | -Inf | -Inf |
| S/N | 23.9 | 42.1 | 48.7 |
| S/N(c) | 0.0 | 0.0 | 0.0 |
| SN(E/C) |
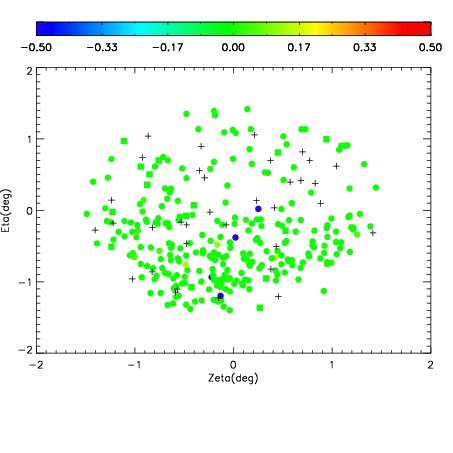
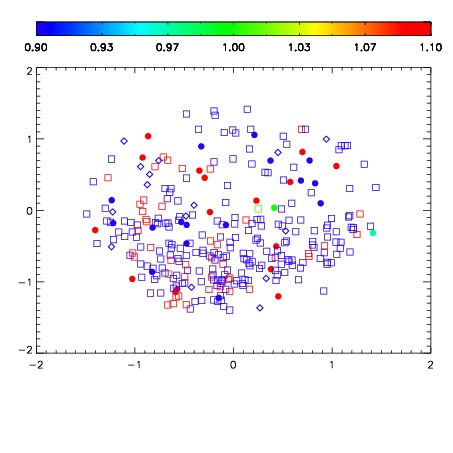
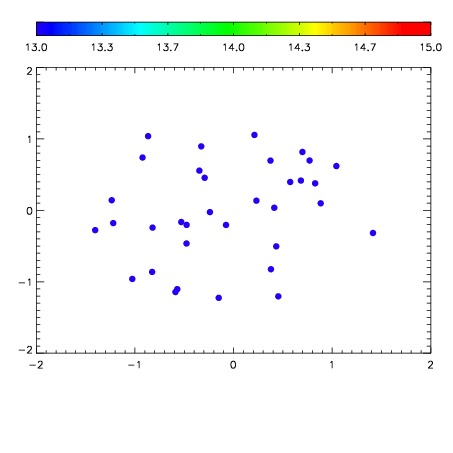

| Frame | Nreads | Zeropoints | Mag plots | Spatial mag deviation | Spatial sky 16325A emission deviations (filled: sky, open: star) | Spatial sky continuum emission | Spatial sky telluric CO2 absorption deviations (filled: H < 10) | |||||||||||||||||||||||
| 0 | 0 |
|
|
|
|
|
|
| IPAIR | NAME | SHIFT | NEWSHIFT | S/N | NAME | SHIFT | NEWSHIFT | S/N |
| 0 | 17840054 | 0.513281 | 0.00000 | 19.1947 | 17840055 | 0.00172850 | 0.511553 | 19.1990 |
| 1 | 17840050 | 0.512575 | 0.000706017 | 19.1886 | 17840052 | 0.00162805 | 0.511653 | 19.1896 |
| 2 | 17840053 | 0.512613 | 0.000667989 | 19.1729 | 17840051 | 0.00172558 | 0.511555 | 19.1529 |
| 3 | 17840049 | 0.512773 | 0.000508010 | 19.0858 | 17840048 | 0.00000 | 0.513281 | 19.0184 |