| Red | Green | Blue | |
| z | 17.64 | ||
| znorm | Inf | ||
| sky | -Inf | -Inf | -Inf |
| S/N | 17.4 | 33.0 | 35.1 |
| S/N(c) | 0.0 | 0.0 | 0.0 |
| SN(E/C) |
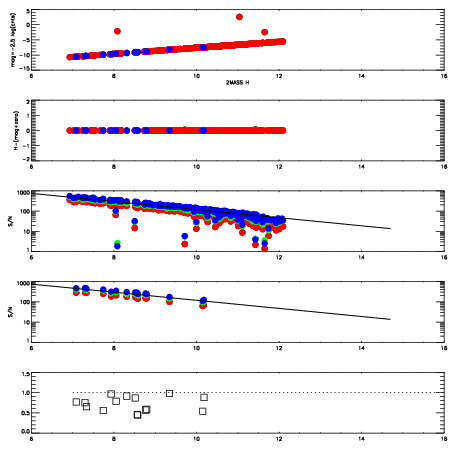
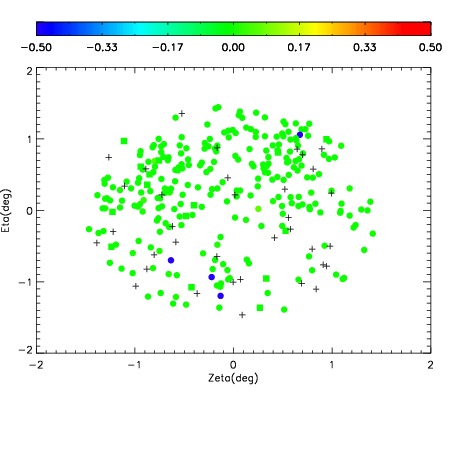
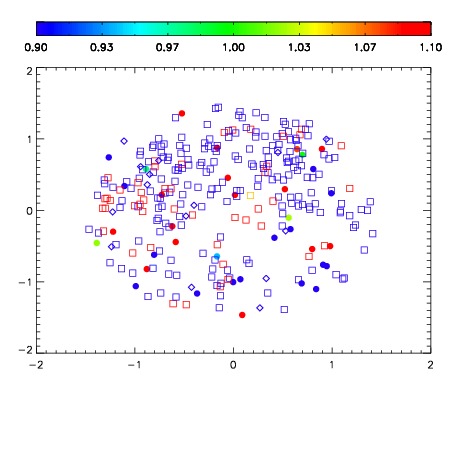


| Frame | Nreads | Zeropoints | Mag plots | Spatial mag deviation | Spatial sky 16325A emission deviations (filled: sky, open: star) | Spatial sky continuum emission | Spatial sky telluric CO2 absorption deviations (filled: H < 10) | |||||||||||||||||||||||
| 0 | 0 |
|
|
|
|
|
|
| IPAIR | NAME | SHIFT | NEWSHIFT | S/N | NAME | SHIFT | NEWSHIFT | S/N |
| 0 | 17850065 | 0.508362 | 0.00000 | 18.3730 | 17850063 | 0.00398312 | 0.504379 | 18.1245 |
| 1 | 17850060 | 0.507138 | 0.00122398 | 18.7192 | 17850062 | 0.00230790 | 0.506054 | 18.8155 |
| 2 | 17850061 | 0.507777 | 0.000585020 | 18.6939 | 17850059 | 0.00000 | 0.508362 | 18.7086 |
| 3 | 17850064 | 0.507654 | 0.000707984 | 18.4759 | 17850066 | -0.00261744 | 0.510979 | 18.1448 |