| Red | Green | Blue | |
| z | 17.64 | ||
| znorm | Inf | ||
| sky | -Inf | -Inf | -Inf |
| S/N | 27.7 | 43.9 | 55.4 |
| S/N(c) | 0.0 | 0.0 | 0.0 |
| SN(E/C) |
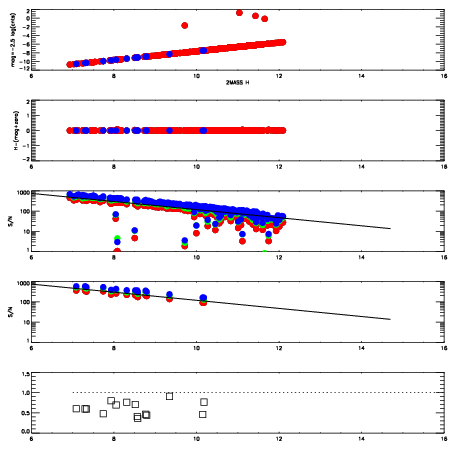
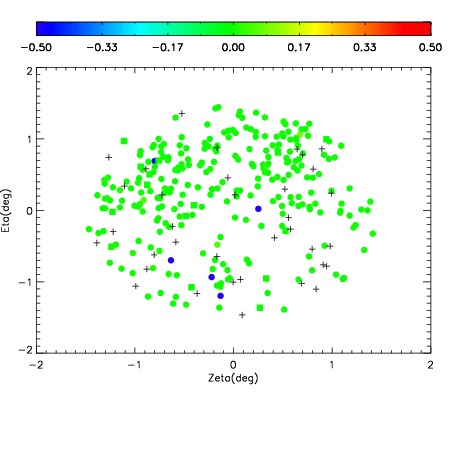
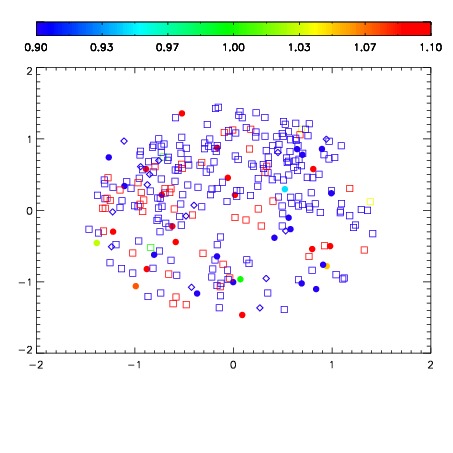
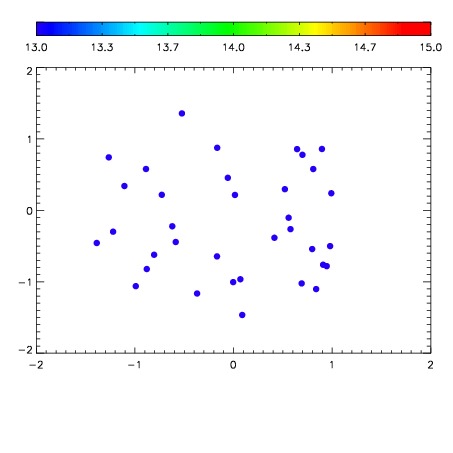

| Frame | Nreads | Zeropoints | Mag plots | Spatial mag deviation | Spatial sky 16325A emission deviations (filled: sky, open: star) | Spatial sky continuum emission | Spatial sky telluric CO2 absorption deviations (filled: H < 10) | |||||||||||||||||||||||
| 0 | 0 |
|
|
|
|
|
|
| IPAIR | NAME | SHIFT | NEWSHIFT | S/N | NAME | SHIFT | NEWSHIFT | S/N |
| 0 | 17860050 | 6.89011e-05 | 0.00000 | 19.1678 | 17860051 | -0.512064 | 0.512133 | 19.1826 |
| 1 | 17860049 | 2.12921e-05 | 4.76090e-05 | 19.1394 | 17860048 | -0.511479 | 0.511548 | 19.0951 |
| 2 | 17860046 | 0.00000 | 6.89011e-05 | 19.0739 | 17860052 | -0.512813 | 0.512882 | 19.0527 |
| 3 | 17860053 | -0.000728213 | 0.000797114 | 19.0495 | 17860047 | -0.512092 | 0.512161 | 18.9825 |