| Red | Green | Blue | |
| z | 17.64 | ||
| znorm | Inf | ||
| sky | -Inf | -Inf | -Inf |
| S/N | 7.2 | 15.1 | 18.1 |
| S/N(c) | 0.0 | 0.0 | 0.0 |
| SN(E/C) |

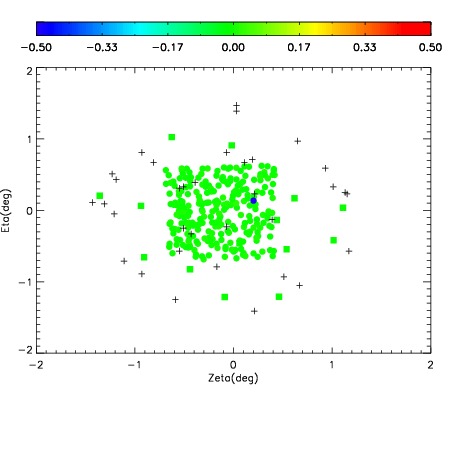
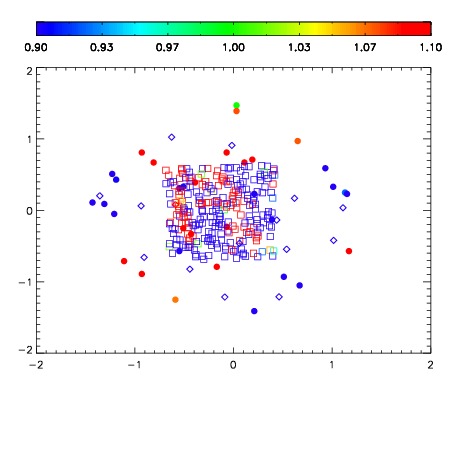


| Frame | Nreads | Zeropoints | Mag plots | Spatial mag deviation | Spatial sky 16325A emission deviations (filled: sky, open: star) | Spatial sky continuum emission | Spatial sky telluric CO2 absorption deviations (filled: H < 10) | |||||||||||||||||||||||
| 0 | 0 |
|
|
|
|
|
|
| IPAIR | NAME | SHIFT | NEWSHIFT | S/N | NAME | SHIFT | NEWSHIFT | S/N |
| 0 | 17870083 | 0.516205 | 0.00000 | 16.9899 | 17870085 | 0.00492857 | 0.511276 | 16.9965 |
| 1 | 17870082 | 0.515288 | 0.000917017 | 17.6761 | 17870081 | 0.00000 | 0.516205 | 18.1036 |
| 2 | 17870087 | 0.515468 | 0.000737011 | 17.1057 | 17870088 | 0.00515353 | 0.511051 | 17.4545 |
| 3 | 17870086 | 0.515063 | 0.00114202 | 16.8589 | 17870084 | 0.00516487 | 0.511040 | 16.8485 |