| Red | Green | Blue | |
| z | 17.64 | ||
| znorm | Inf | ||
| sky | -Inf | -Inf | -Inf |
| S/N | 29.9 | 52.4 | 62.4 |
| S/N(c) | 0.0 | 0.0 | 0.0 |
| SN(E/C) |
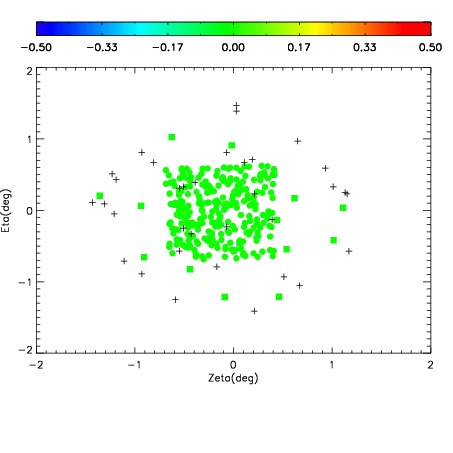
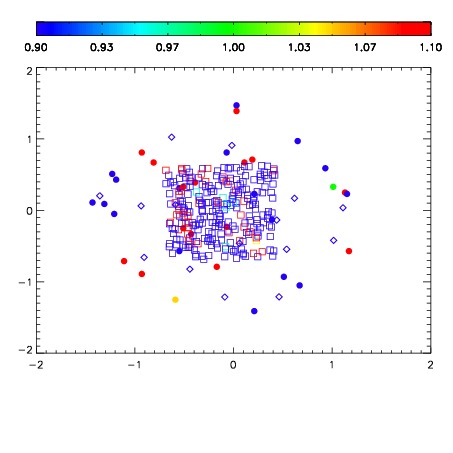


| Frame | Nreads | Zeropoints | Mag plots | Spatial mag deviation | Spatial sky 16325A emission deviations (filled: sky, open: star) | Spatial sky continuum emission | Spatial sky telluric CO2 absorption deviations (filled: H < 10) | |||||||||||||||||||||||
| 0 | 0 |
|
|
|
|
|
|
| IPAIR | NAME | SHIFT | NEWSHIFT | S/N | NAME | SHIFT | NEWSHIFT | S/N |
| 0 | 17880080 | 0.509804 | 0.00000 | 19.2521 | 17880081 | 0.00131918 | 0.508485 | 19.2689 |
| 1 | 17880076 | 0.507482 | 0.00232202 | 19.2348 | 17880078 | 0.00655892 | 0.503245 | 19.2447 |
| 2 | 17880075 | 0.507825 | 0.00197899 | 19.2237 | 17880077 | 0.00674865 | 0.503055 | 19.2242 |
| 3 | 17880079 | 0.509659 | 0.000145018 | 19.2011 | 17880074 | 0.00000 | 0.509804 | 19.1853 |