| Red | Green | Blue | |
| z | 17.63 | ||
| znorm | Inf | ||
| sky | -NaN | -NaN | -Inf |
| S/N | 38.4 | 65.4 | 77.5 |
| S/N(c) | 0.0 | 0.0 | 0.0 |
| SN(E/C) |
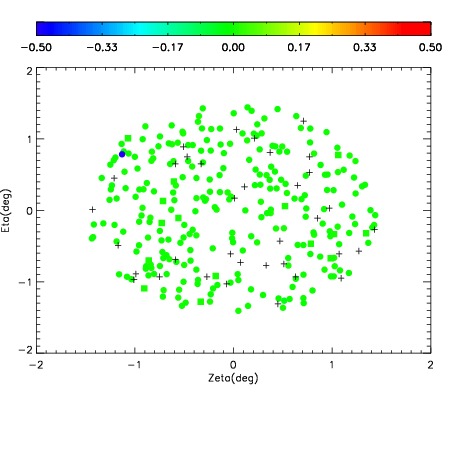
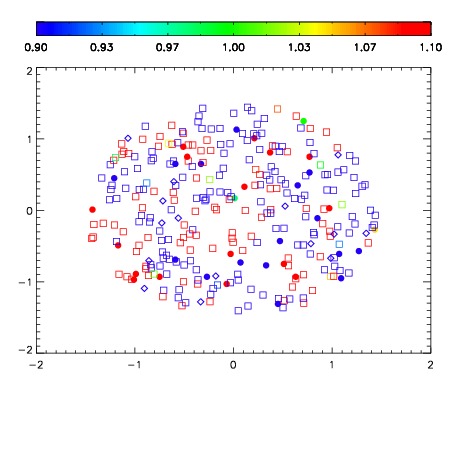
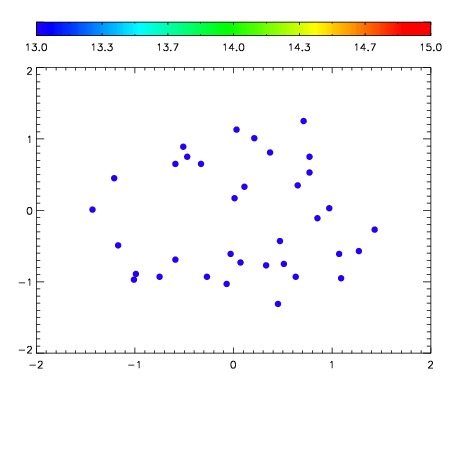

| Frame | Nreads | Zeropoints | Mag plots | Spatial mag deviation | Spatial sky 16325A emission deviations (filled: sky, open: star) | Spatial sky continuum emission | Spatial sky telluric CO2 absorption deviations (filled: H < 10) | |||||||||||||||||||||||
| 0 | 0 |
|
|
|
|
|
|
| IPAIR | NAME | SHIFT | NEWSHIFT | S/N | NAME | SHIFT | NEWSHIFT | S/N |
| 0 | 18270035 | 0.510636 | 0.00000 | 19.1765 | 18270030 | 0.00372909 | 0.506907 | 19.1799 |
| 1 | 18270032 | 0.510097 | 0.000538945 | 19.1849 | 18270033 | 0.00494521 | 0.505691 | 19.1974 |
| 2 | 18270027 | 0.506304 | 0.00433195 | 19.1756 | 18270022 | 0.00000 | 0.510636 | 19.1229 |
| 3 | 18270031 | 0.509669 | 0.000966966 | 19.1746 | 18270025 | 0.000758415 | 0.509878 | 19.1216 |
| 4 | 18270028 | 0.507357 | 0.00327897 | 19.1489 | 18270029 | 0.00388433 | 0.506752 | 19.1195 |
| 5 | 18270024 | 0.506376 | 0.00425994 | 19.0963 | 18270026 | 0.000850744 | 0.509785 | 19.1149 |
| 6 | 18270023 | 0.505576 | 0.00505996 | 19.0838 | 18270034 | 0.00514692 | 0.505489 | 19.1054 |