| Red | Green | Blue | |
| z | 17.64 | ||
| znorm | Inf | ||
| sky | -Inf | -Inf | -NaN |
| S/N | 26.3 | 50.1 | 54.5 |
| S/N(c) | 0.0 | 0.0 | 0.0 |
| SN(E/C) |
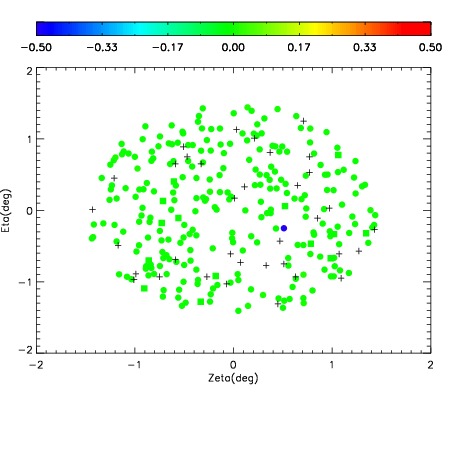
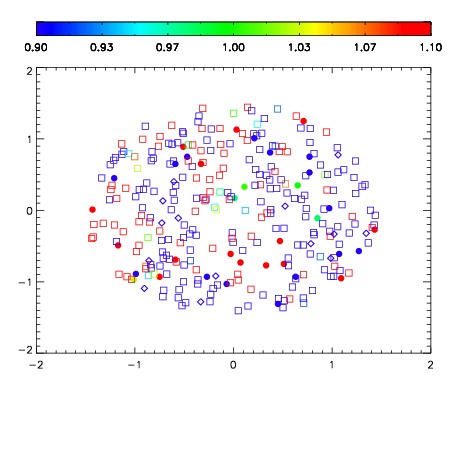
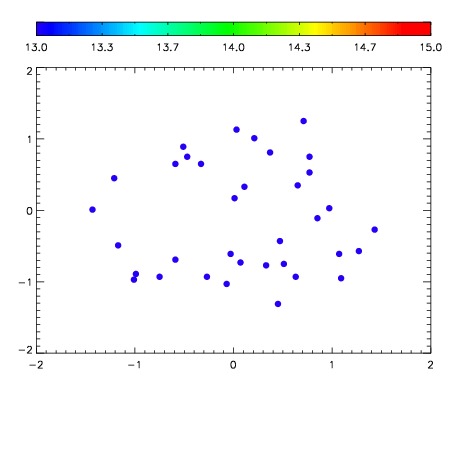

| Frame | Nreads | Zeropoints | Mag plots | Spatial mag deviation | Spatial sky 16325A emission deviations (filled: sky, open: star) | Spatial sky continuum emission | Spatial sky telluric CO2 absorption deviations (filled: H < 10) | |||||||||||||||||||||||
| 0 | 0 |
|
|
|
|
|
|
| IPAIR | NAME | SHIFT | NEWSHIFT | S/N | NAME | SHIFT | NEWSHIFT | S/N |
| 0 | 18430065 | 0.00272777 | 0.00000 | 18.8640 | 18430058 | -0.501053 | 0.503781 | 18.8400 |
| 1 | 18430057 | 0.00000 | 0.00272777 | 18.8779 | 18430063 | -0.499362 | 0.502090 | 18.8703 |
| 2 | 18430064 | 0.00240123 | 0.000326540 | 18.8615 | 18430059 | -0.500286 | 0.503014 | 18.8330 |
| 3 | 18430061 | 0.00226346 | 0.000464310 | 18.8026 | 18430066 | -0.494950 | 0.497678 | 18.8007 |
| 4 | 18430060 | 0.00167266 | 0.00105511 | 18.7271 | 18430062 | -0.499183 | 0.501911 | 18.7152 |