| Red | Green | Blue | |
| z | 17.64 | ||
| znorm | Inf | ||
| sky | -Inf | -NaN | -Inf |
| S/N | 19.7 | 34.4 | 38.9 |
| S/N(c) | 0.0 | 0.0 | 0.0 |
| SN(E/C) |
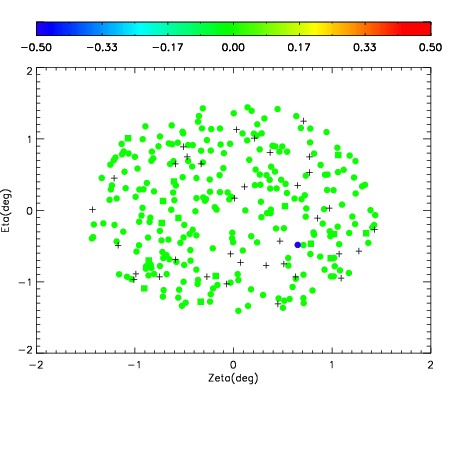
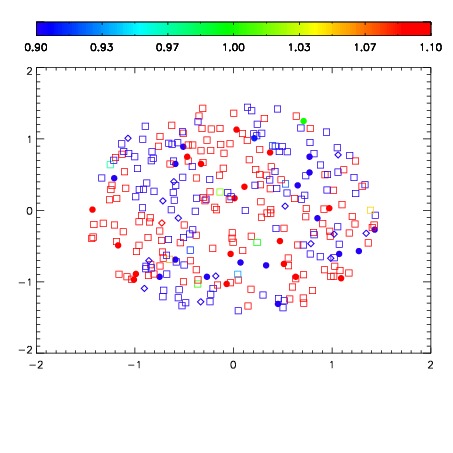
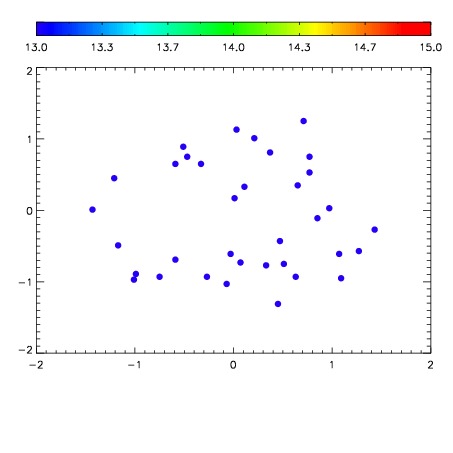

| Frame | Nreads | Zeropoints | Mag plots | Spatial mag deviation | Spatial sky 16325A emission deviations (filled: sky, open: star) | Spatial sky continuum emission | Spatial sky telluric CO2 absorption deviations (filled: H < 10) | |||||||||||||||||||||||
| 0 | 0 |
|
|
|
|
|
|
| IPAIR | NAME | SHIFT | NEWSHIFT | S/N | NAME | SHIFT | NEWSHIFT | S/N |
| 0 | 18500035 | 0.00114407 | 0.00000 | 18.7445 | 18500033 | -0.503449 | 0.504593 | 18.8677 |
| 1 | 18500034 | -0.000345885 | 0.00148996 | 18.8154 | 18500037 | -0.501591 | 0.502735 | 18.8840 |
| 2 | 18500031 | 0.00000 | 0.00114407 | 18.5892 | 18500032 | -0.502124 | 0.503268 | 18.7942 |