| Red | Green | Blue | |
| z | 17.64 | ||
| znorm | Inf | ||
| sky | -Inf | -NaN | -Inf |
| S/N | 11.6 | 23.9 | 26.4 |
| S/N(c) | 0.0 | 0.0 | 0.0 |
| SN(E/C) |
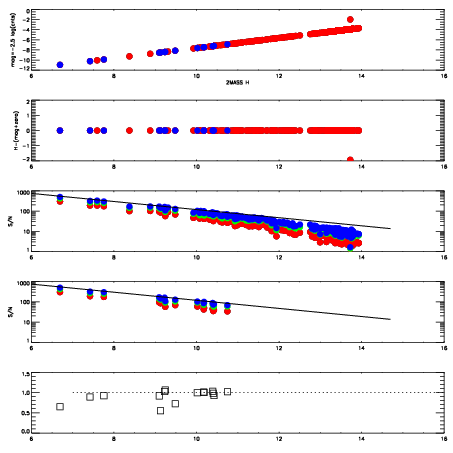
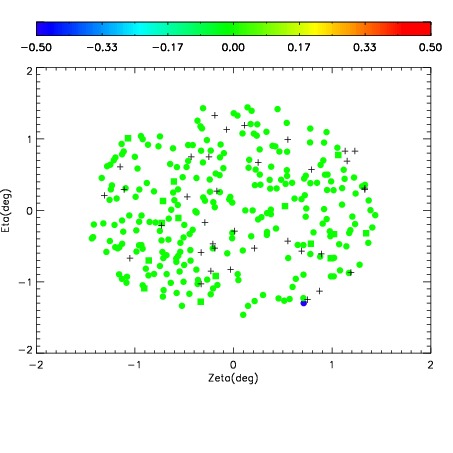
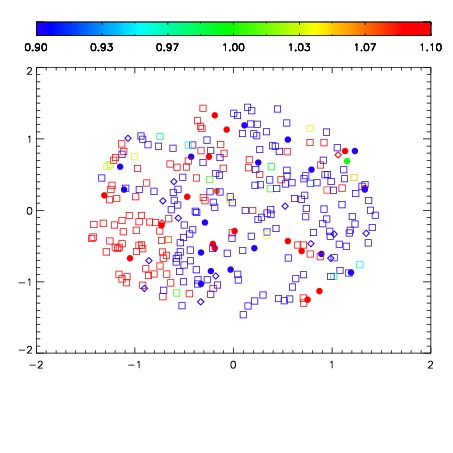
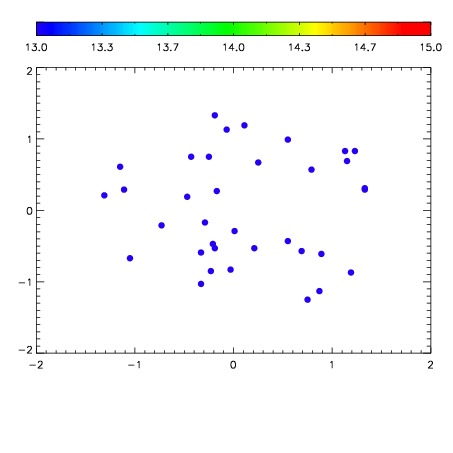

| Frame | Nreads | Zeropoints | Mag plots | Spatial mag deviation | Spatial sky 16325A emission deviations (filled: sky, open: star) | Spatial sky continuum emission | Spatial sky telluric CO2 absorption deviations (filled: H < 10) | |||||||||||||||||||||||
| 0 | 0 |
|
|
|
|
|
|
| IPAIR | NAME | SHIFT | NEWSHIFT | S/N | NAME | SHIFT | NEWSHIFT | S/N |
| 0 | 18290017 | 0.505253 | 0.00000 | 17.7438 | 18290014 | -0.000375034 | 0.505628 | 17.8697 |
| 1 | 18290013 | 0.503171 | 0.00208199 | 18.0796 | 18290011 | 0.00000 | 0.505253 | 18.4004 |
| 2 | 18290012 | 0.502493 | 0.00275999 | 18.0717 | 18290015 | 0.000124533 | 0.505129 | 18.0971 |
| 3 | 18290016 | 0.504811 | 0.000442028 | 17.5852 | 18290018 | 0.00451611 | 0.500737 | 17.3539 |