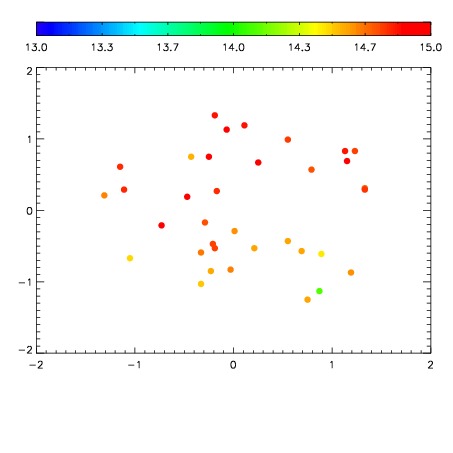
| Frame | Nreads | Zeropoints | Mag plots
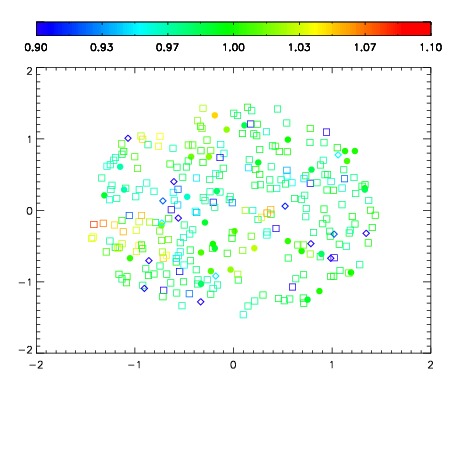
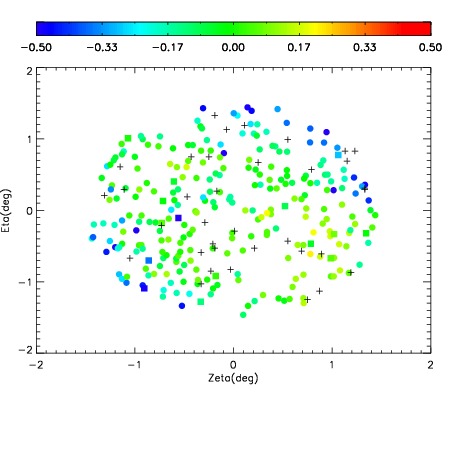
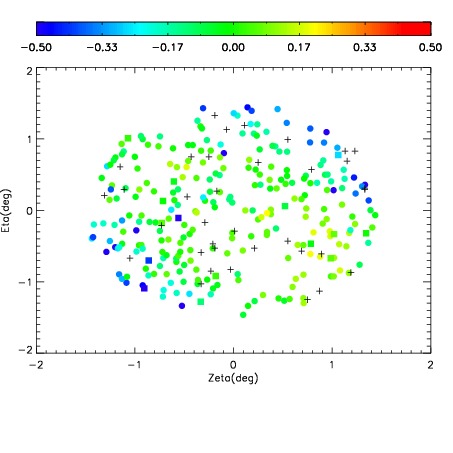
| Spatial mag deviation
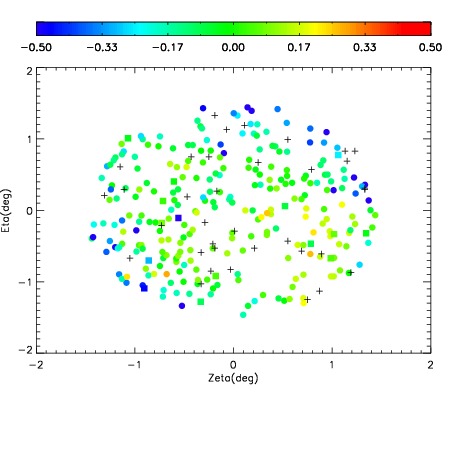
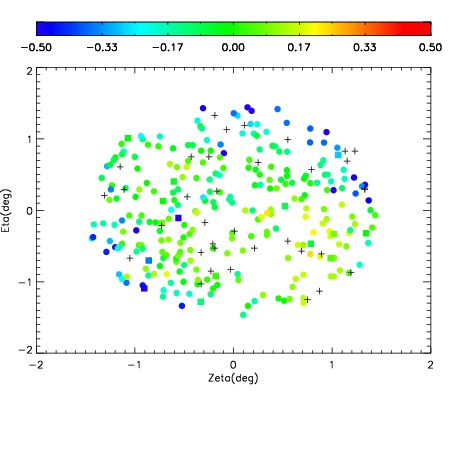
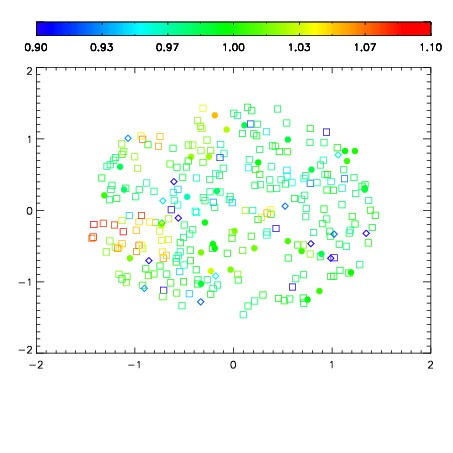
| Spatial sky 16325A emission deviations (filled: sky, open: star)
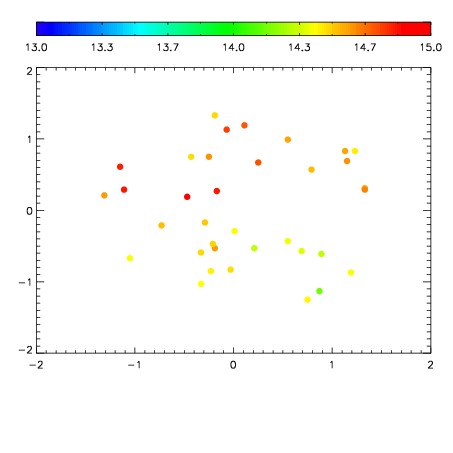
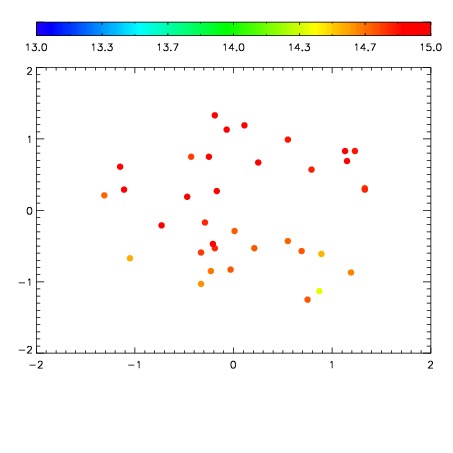
| Spatial sky continuum emission
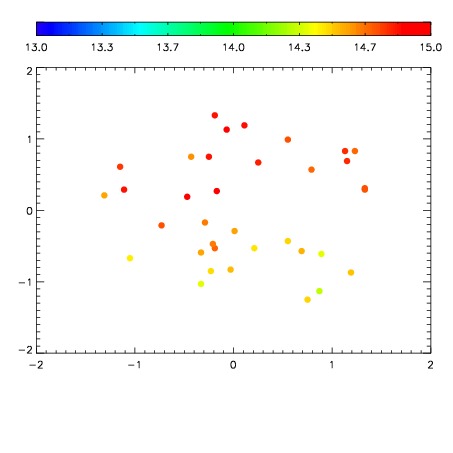
| Spatial sky telluric CO2 absorption deviations (filled: H < 10)
|
| 18480053
| 94
| | Red | Green | Blue
| | z | | 19.80
| | znorm | | 14.87
| | sky | 14.9 | 14.5 | 14.6
| | S/N | 23.9 | 35.2 | 41.2
| | S/N(c) | 23.6 | 30.7 | 71.8
| | SN(E/C) 0.85
|
| 
| 
| 
| 
| 
|
| 18480054
| 94
| | Red | Green | Blue
| | z | | 19.84
| | znorm | | 14.90
| | sky | 14.9 | 14.7 | 14.7
| | S/N | 24.6 | 36.6 | 42.2
| | S/N(c) | 23.6 | 31.3 | 73.0
| | SN(E/C) 0.76
|
| 
| 
| 
| 
| 
|
| 18480055
| 94
| | Red | Green | Blue
| | z | | 19.78
| | znorm | | 14.85
| | sky | 14.9 | 14.7 | 14.8
| | S/N | 24.2 | 35.3 | 40.6
| | S/N(c) | 22.9 | 31.0 | 70.9
| | SN(E/C) 0.88
|
| 
| 
| 
| 
| 
|
| 18480056
| 94
| | Red | Green | Blue
| | z | | 19.81
| | znorm | | 14.88
| | sky | 15.0 | 14.8 | 14.7
| | S/N | 25.2 | 35.9 | 41.7
| | S/N(c) | 23.2 | 31.8 | 71.9
| | SN(E/C) 0.87
|
| 
| 
| 
| 
| 
|