| Red | Green | Blue | |
| z | 17.64 | ||
| znorm | Inf | ||
| sky | -Inf | -Inf | -Inf |
| S/N | 17.3 | 33.6 | 35.4 |
| S/N(c) | 0.0 | 0.0 | 0.0 |
| SN(E/C) |
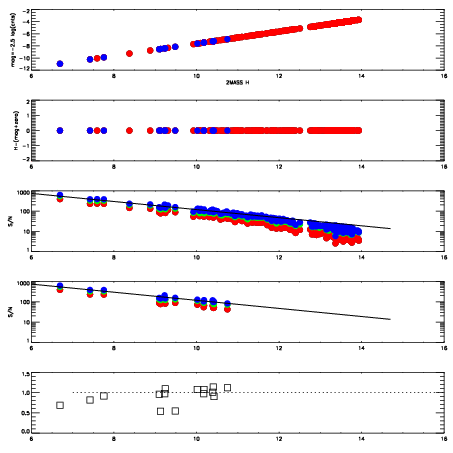
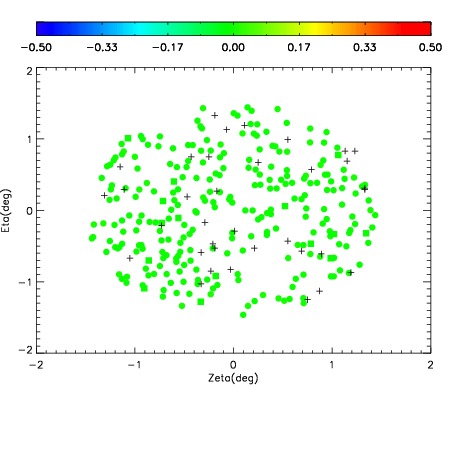
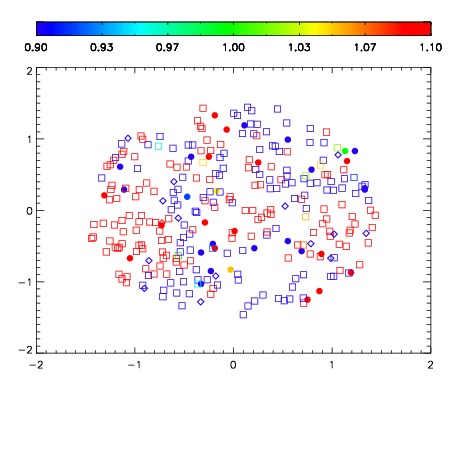
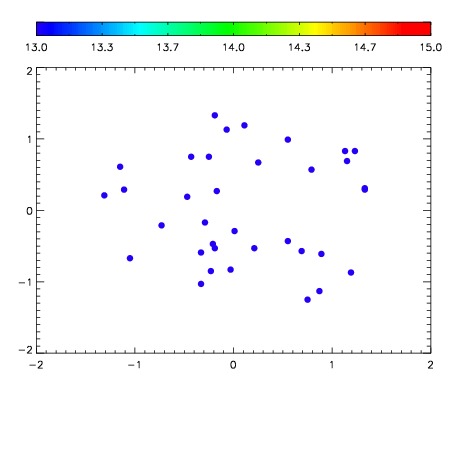

| Frame | Nreads | Zeropoints | Mag plots | Spatial mag deviation | Spatial sky 16325A emission deviations (filled: sky, open: star) | Spatial sky continuum emission | Spatial sky telluric CO2 absorption deviations (filled: H < 10) | |||||||||||||||||||||||
| 0 | 0 |
|
|
|
|
|
|
| IPAIR | NAME | SHIFT | NEWSHIFT | S/N | NAME | SHIFT | NEWSHIFT | S/N |
| 0 | 18510052 | 0.496809 | 0.00000 | 18.5723 | 18510049 | 0.00173899 | 0.495070 | 18.4453 |
| 1 | 18510051 | 0.496548 | 0.000261009 | 18.5622 | 18510046 | 0.00000 | 0.496809 | 18.3767 |
| 2 | 18510048 | 0.496665 | 0.000144005 | 18.3267 | 18510050 | 0.00234861 | 0.494460 | 18.3725 |
| 3 | 18510047 | 0.496507 | 0.000302017 | 18.1694 | 18510053 | 0.00336587 | 0.493443 | 18.3576 |