| Red | Green | Blue | |
| z | 17.64 | ||
| znorm | Inf | ||
| sky | -Inf | -Inf | -Inf |
| S/N | 15.5 | 23.3 | 31.0 |
| S/N(c) | 22.6 | 10.6 | 18.9 |
| SN(E/C) |
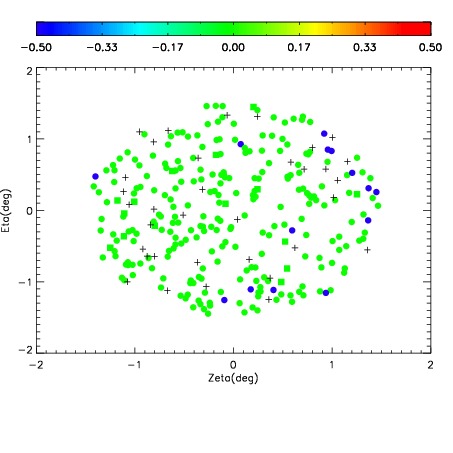
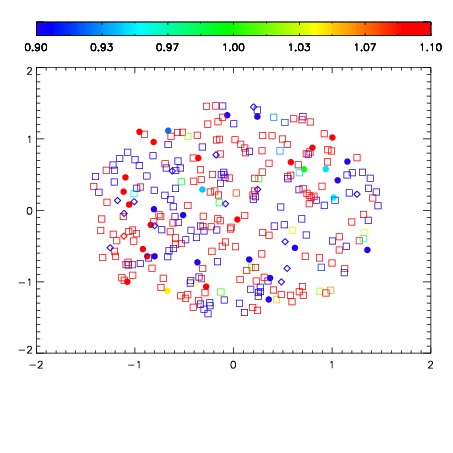
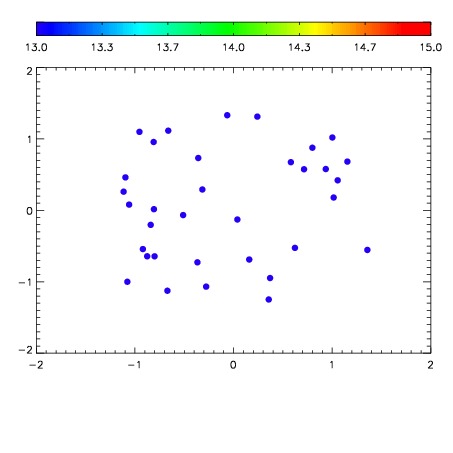

| Frame | Nreads | Zeropoints | Mag plots | Spatial mag deviation | Spatial sky 16325A emission deviations (filled: sky, open: star) | Spatial sky continuum emission | Spatial sky telluric CO2 absorption deviations (filled: H < 10) | |||||||||||||||||||||||
| 0 | 0 |
|
|
|
|
|
|
| IPAIR | NAME | SHIFT | NEWSHIFT | S/N | NAME | SHIFT | NEWSHIFT | S/N |
| 0 | 18430072 | 0.501792 | 0.00000 | 18.6566 | 18430070 | 0.00000 | 0.501792 | 18.6195 |
| 1 | 18430071 | 0.501228 | 0.000564039 | 18.6060 | 18430073 | 0.00192370 | 0.499868 | 18.6156 |