| Red | Green | Blue | |
| z | 17.65 | ||
| znorm | Inf | ||
| sky | -Inf | -Inf | -Inf |
| S/N | 11.9 | 19.4 | 26.1 |
| S/N(c) | 21.2 | 10.1 | 17.9 |
| SN(E/C) |
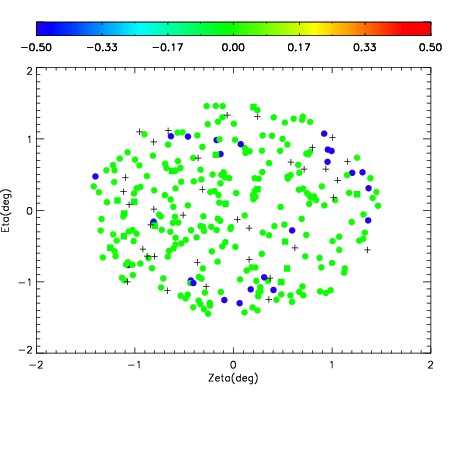
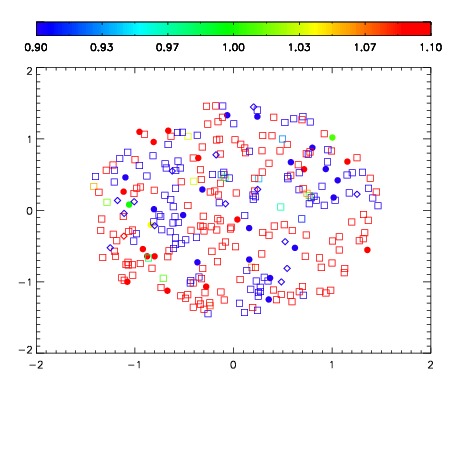
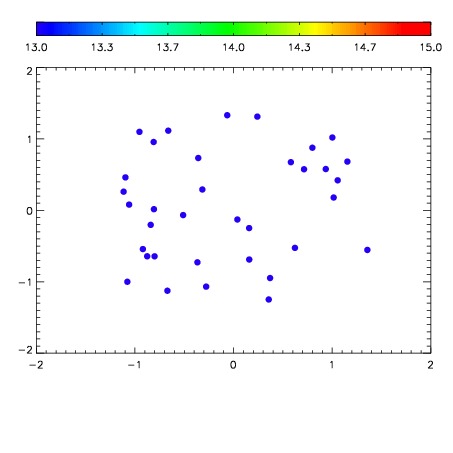

| Frame | Nreads | Zeropoints | Mag plots | Spatial mag deviation | Spatial sky 16325A emission deviations (filled: sky, open: star) | Spatial sky continuum emission | Spatial sky telluric CO2 absorption deviations (filled: H < 10) | |||||||||||||||||||||||
| 0 | 0 |
|
|
|
|
|
|
| IPAIR | NAME | SHIFT | NEWSHIFT | S/N | NAME | SHIFT | NEWSHIFT | S/N |
| 0 | 18470068 | 0.00000 | 0.00000 | 17.6431 | 18470069 | -0.505103 | 0.505103 | 17.9004 |
| 1 | 18470072 | -0.000830082 | 0.000830082 | 18.2610 | 18470070 | -0.505329 | 0.505329 | 18.1222 |
| 2 | 18470071 | -0.00154657 | 0.00154657 | 18.1792 | 18470073 | -0.504764 | 0.504764 | 18.0807 |