| Red | Green | Blue | |
| z | 17.64 | ||
| znorm | Inf | ||
| sky | -Inf | -NaN | -NaN |
| S/N | 26.4 | 38.4 | 50.5 |
| S/N(c) | 39.2 | 17.9 | 31.7 |
| SN(E/C) |


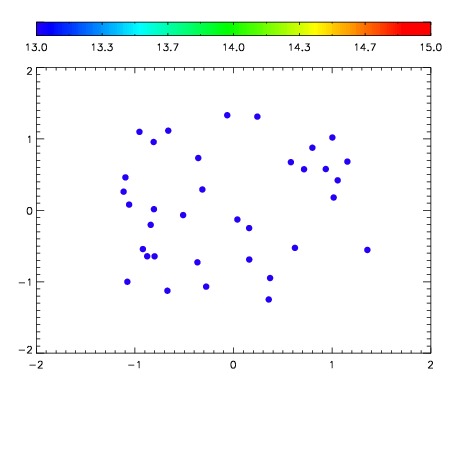

| Frame | Nreads | Zeropoints | Mag plots | Spatial mag deviation | Spatial sky 16325A emission deviations (filled: sky, open: star) | Spatial sky continuum emission | Spatial sky telluric CO2 absorption deviations (filled: H < 10) | |||||||||||||||||||||||
| 0 | 0 |
|
|
|
|
|
|
| IPAIR | NAME | SHIFT | NEWSHIFT | S/N | NAME | SHIFT | NEWSHIFT | S/N |
| 0 | 18480067 | 0.000455841 | 0.00000 | 18.9326 | 18480062 | -0.504604 | 0.505060 | 18.9760 |
| 1 | 18480063 | -0.00131613 | 0.00177197 | 19.0206 | 18480061 | -0.505079 | 0.505535 | 18.9959 |
| 2 | 18480064 | -0.000658878 | 0.00111472 | 18.9978 | 18480066 | -0.504280 | 0.504736 | 18.9825 |
| 3 | 18480060 | 0.00000 | 0.000455841 | 18.9092 | 18480065 | -0.504190 | 0.504646 | 18.9749 |