| Red | Green | Blue | |
| z | 17.63 | ||
| znorm | Inf | ||
| sky | -Inf | -NaN | -NaN |
| S/N | 23.5 | 35.6 | 47.5 |
| S/N(c) | 31.3 | 0.7 | 17.1 |
| SN(E/C) |
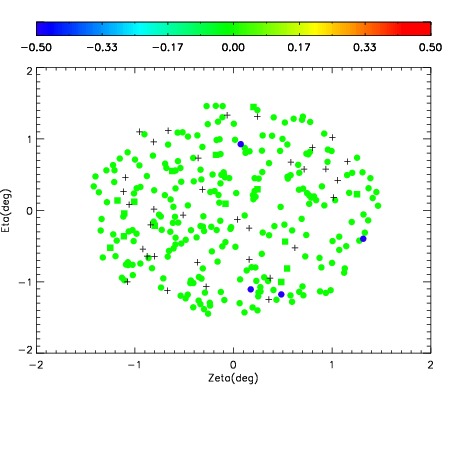

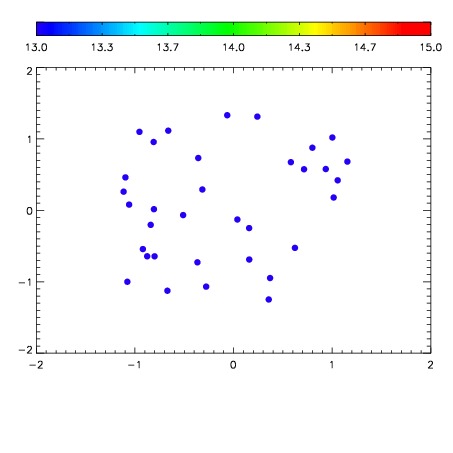

| Frame | Nreads | Zeropoints | Mag plots | Spatial mag deviation | Spatial sky 16325A emission deviations (filled: sky, open: star) | Spatial sky continuum emission | Spatial sky telluric CO2 absorption deviations (filled: H < 10) | |||||||||||||||||||||||
| 0 | 0 |
|
|
|
|
|
|
| IPAIR | NAME | SHIFT | NEWSHIFT | S/N | NAME | SHIFT | NEWSHIFT | S/N |
| 0 | 18520032 | 0.495206 | 0.00000 | 18.6197 | 18520033 | 0.00218246 | 0.493024 | 18.5739 |
| 1 | 18520027 | 0.494067 | 0.00113899 | 18.7488 | 18520029 | 0.000778496 | 0.494428 | 18.8159 |
| 2 | 18520028 | 0.494981 | 0.000225008 | 18.7464 | 18520030 | 0.000510774 | 0.494695 | 18.7746 |
| 3 | 18520031 | 0.494157 | 0.00104901 | 18.6812 | 18520026 | 0.00000 | 0.495206 | 18.6920 |