| Red | Green | Blue | |
| z | 17.64 | ||
| znorm | Inf | ||
| sky | -Inf | -NaN | -NaN |
| S/N | 28.5 | 42.7 | 57.1 |
| S/N(c) | 17.3 | 72.0 | 40.0 |
| SN(E/C) |
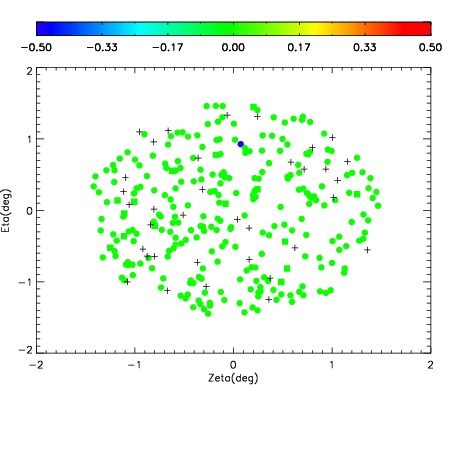
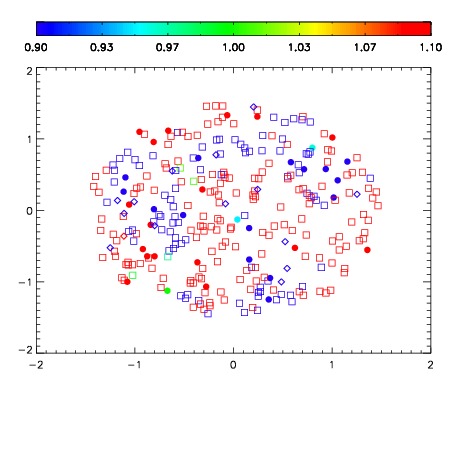


| Frame | Nreads | Zeropoints | Mag plots | Spatial mag deviation | Spatial sky 16325A emission deviations (filled: sky, open: star) | Spatial sky continuum emission | Spatial sky telluric CO2 absorption deviations (filled: H < 10) | |||||||||||||||||||||||
| 0 | 0 |
|
|
|
|
|
|
| IPAIR | NAME | SHIFT | NEWSHIFT | S/N | NAME | SHIFT | NEWSHIFT | S/N |
| 0 | 18550025 | 0.490334 | 0.00000 | 18.8600 | 18550034 | -0.000846491 | 0.491181 | 18.9137 |
| 1 | 18550029 | 0.489667 | 0.000667006 | 19.0067 | 18550031 | -0.000225851 | 0.490560 | 19.0165 |
| 2 | 18550032 | 0.487544 | 0.00279000 | 18.9966 | 18550030 | -6.03419e-05 | 0.490394 | 18.9966 |
| 3 | 18550033 | 0.487640 | 0.00269401 | 18.9567 | 18550026 | 0.000556245 | 0.489778 | 18.9749 |
| 4 | 18550028 | 0.489631 | 0.000703007 | 18.9275 | 18550027 | 0.000628981 | 0.489705 | 18.9521 |
| 5 | 18550024 | 0.490202 | 0.000131994 | 18.7798 | 18550023 | 0.00000 | 0.490334 | 18.7848 |