| Red | Green | Blue | |
| z | 17.64 | ||
| znorm | Inf | ||
| sky | -Inf | -Inf | -Inf |
| S/N | 25.3 | 38.5 | 50.7 |
| S/N(c) | 39.7 | 19.1 | 30.8 |
| SN(E/C) |
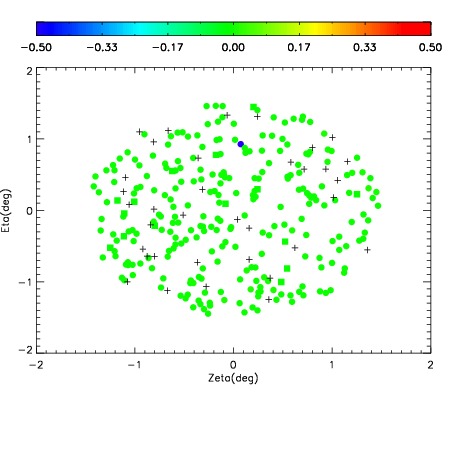
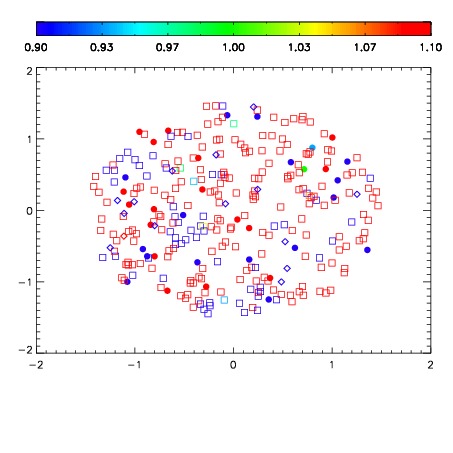


| Frame | Nreads | Zeropoints | Mag plots | Spatial mag deviation | Spatial sky 16325A emission deviations (filled: sky, open: star) | Spatial sky continuum emission | Spatial sky telluric CO2 absorption deviations (filled: H < 10) | |||||||||||||||||||||||
| 0 | 0 |
|
|
|
|
|
|
| IPAIR | NAME | SHIFT | NEWSHIFT | S/N | NAME | SHIFT | NEWSHIFT | S/N |
| 0 | 18780044 | 0.507362 | 0.00000 | 18.5196 | 18780045 | -1.25691e-05 | 0.507375 | 18.5109 |
| 1 | 18780051 | 0.506455 | 0.000907004 | 18.6214 | 18780050 | -0.00142906 | 0.508791 | 18.6485 |
| 2 | 18780047 | 0.505110 | 0.00225198 | 18.5796 | 18780049 | -0.00122350 | 0.508586 | 18.5924 |
| 3 | 18780048 | 0.505481 | 0.00188100 | 18.5503 | 18780046 | -0.000759007 | 0.508121 | 18.5271 |
| 4 | 18780052 | 0.505923 | 0.00143903 | 18.5218 | 18780053 | -0.00220174 | 0.509564 | 18.5158 |
| 5 | 18780043 | 0.507078 | 0.000284016 | 18.2761 | 18780042 | 0.00000 | 0.507362 | 18.2786 |