| Red | Green | Blue | |
| z | 17.64 | ||
| znorm | Inf | ||
| sky | -Inf | -Inf | -NaN |
| S/N | 20.9 | 31.6 | 42.9 |
| S/N(c) | 32.5 | 15.4 | 25.5 |
| SN(E/C) |
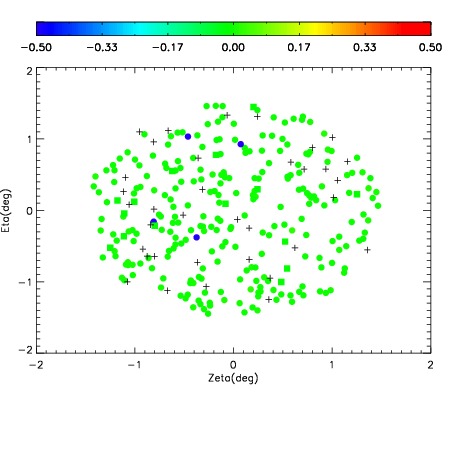
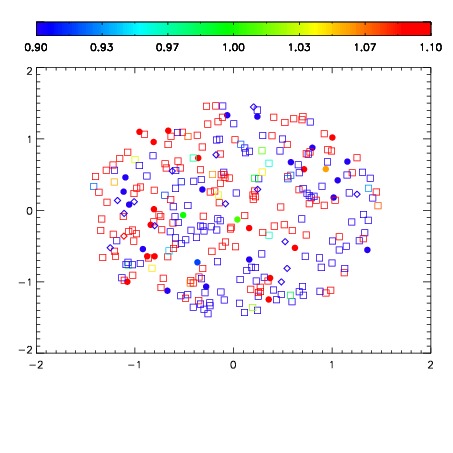
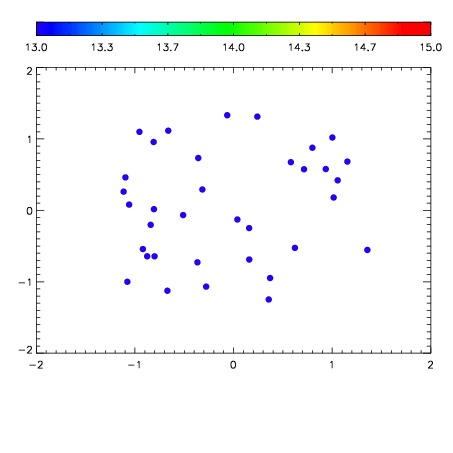

| Frame | Nreads | Zeropoints | Mag plots | Spatial mag deviation | Spatial sky 16325A emission deviations (filled: sky, open: star) | Spatial sky continuum emission | Spatial sky telluric CO2 absorption deviations (filled: H < 10) | |||||||||||||||||||||||
| 0 | 0 |
|
|
|
|
|
|
| IPAIR | NAME | SHIFT | NEWSHIFT | S/N | NAME | SHIFT | NEWSHIFT | S/N |
| 0 | 18810050 | 0.505014 | 0.00000 | 18.2052 | 18810051 | 4.19662e-05 | 0.504972 | 18.0909 |
| 1 | 18810046 | 0.504179 | 0.000835001 | 18.6987 | 18810048 | -0.000292599 | 0.505307 | 18.7184 |
| 2 | 18810049 | 0.504825 | 0.000189006 | 18.6370 | 18810047 | -0.000502508 | 0.505517 | 18.6133 |
| 3 | 18810045 | 0.504244 | 0.000769973 | 18.5800 | 18810044 | 0.00000 | 0.505014 | 18.4998 |