| Red | Green | Blue | |
| z | 17.65 | ||
| znorm | Inf | ||
| sky | -Inf | -Inf | -NaN |
| S/N | 23.4 | 31.8 | 43.2 |
| S/N(c) | 33.0 | 14.8 | 25.3 |
| SN(E/C) |

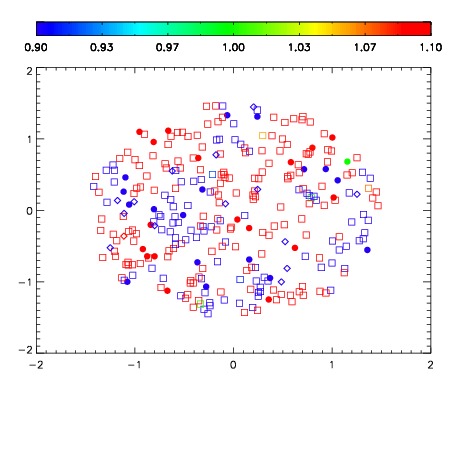


| Frame | Nreads | Zeropoints | Mag plots | Spatial mag deviation | Spatial sky 16325A emission deviations (filled: sky, open: star) | Spatial sky continuum emission | Spatial sky telluric CO2 absorption deviations (filled: H < 10) | |||||||||||||||||||||||
| 0 | 0 |
|
|
|
|
|
|
| IPAIR | NAME | SHIFT | NEWSHIFT | S/N | NAME | SHIFT | NEWSHIFT | S/N |
| 0 | 19000021 | 0.503350 | 0.00000 | 19.2326 | 19000020 | 0.00000 | 0.503350 | 19.2605 |
| 1 | 19000022 | 0.502892 | 0.000458002 | 19.3438 | 19000023 | 0.000431131 | 0.502919 | 19.4610 |