| Red | Green | Blue | |
| z | 17.64 | ||
| znorm | Inf | ||
| sky | -Inf | -Inf | -NaN |
| S/N | 26.5 | 38.7 | 51.8 |
| S/N(c) | 40.9 | 19.5 | 31.9 |
| SN(E/C) |
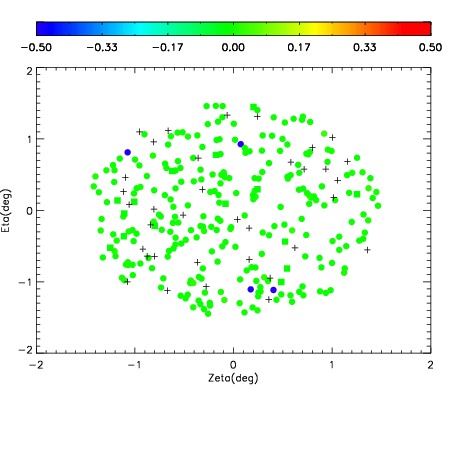

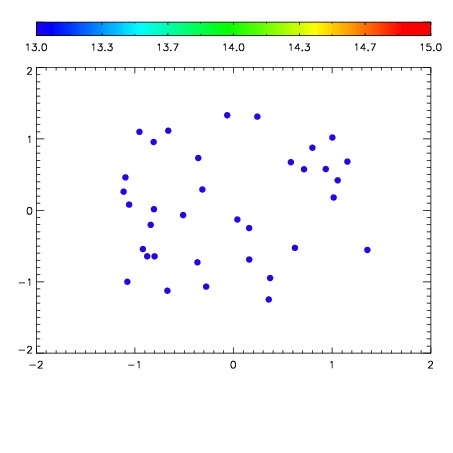

| Frame | Nreads | Zeropoints | Mag plots | Spatial mag deviation | Spatial sky 16325A emission deviations (filled: sky, open: star) | Spatial sky continuum emission | Spatial sky telluric CO2 absorption deviations (filled: H < 10) | |||||||||||||||||||||||
| 0 | 0 |
|
|
|
|
|
|
| IPAIR | NAME | SHIFT | NEWSHIFT | S/N | NAME | SHIFT | NEWSHIFT | S/N |
| 0 | 19030035 | 0.513457 | 0.00000 | 18.9047 | 19030033 | 0.00642735 | 0.507030 | 18.9271 |
| 1 | 19030034 | 0.513016 | 0.000441015 | 18.9400 | 19030032 | 0.00610416 | 0.507353 | 18.9588 |
| 2 | 19030030 | 0.511554 | 0.00190300 | 18.9025 | 19030036 | 0.00626833 | 0.507189 | 18.8785 |
| 3 | 19030031 | 0.512053 | 0.00140399 | 18.8520 | 19030029 | 0.00000 | 0.513457 | 18.8709 |