| Red | Green | Blue | |
| z | 17.64 | ||
| znorm | Inf | ||
| sky | -Inf | -Inf | -NaN |
| S/N | 20.7 | 32.3 | 42.7 |
| S/N(c) | 34.2 | 62.5 | 18.7 |
| SN(E/C) |
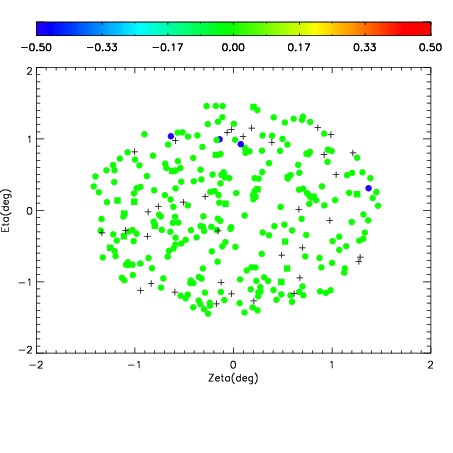
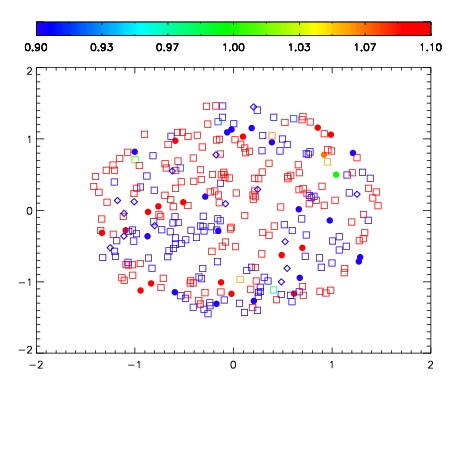
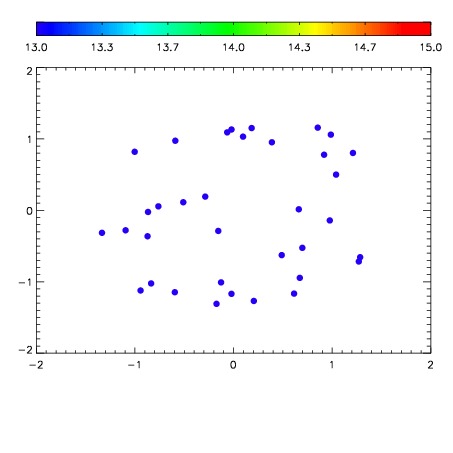

| Frame | Nreads | Zeropoints | Mag plots | Spatial mag deviation | Spatial sky 16325A emission deviations (filled: sky, open: star) | Spatial sky continuum emission | Spatial sky telluric CO2 absorption deviations (filled: H < 10) | |||||||||||||||||||||||
| 0 | 0 |
|
|
|
|
|
|
| IPAIR | NAME | SHIFT | NEWSHIFT | S/N | NAME | SHIFT | NEWSHIFT | S/N |
| 0 | 18500049 | 0.000437664 | 0.00000 | 18.3066 | 18500047 | -0.502081 | 0.502519 | 18.3065 |
| 1 | 18500045 | -0.000682286 | 0.00111995 | 18.6902 | 18500043 | -0.503548 | 0.503986 | 18.6740 |
| 2 | 18500042 | 0.00000 | 0.000437664 | 18.6860 | 18500044 | -0.503576 | 0.504014 | 18.5942 |
| 3 | 18500046 | -0.000132139 | 0.000569803 | 18.5997 | 18500048 | -0.502127 | 0.502565 | 18.3309 |