| Red | Green | Blue | |
| z | 17.63 | ||
| znorm | Inf | ||
| sky | -Inf | -NaN | -NaN |
| S/N | 26.4 | 36.6 | 48.8 |
| S/N(c) | 29.4 | 0.7 | 16.6 |
| SN(E/C) |
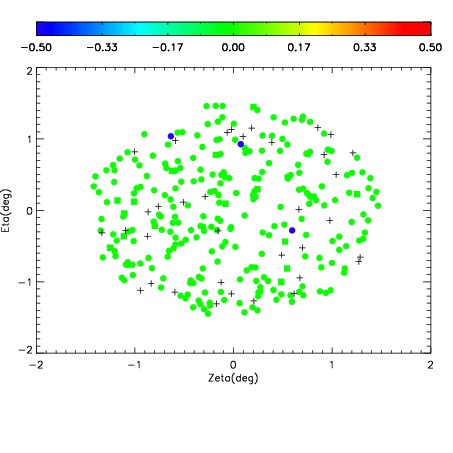
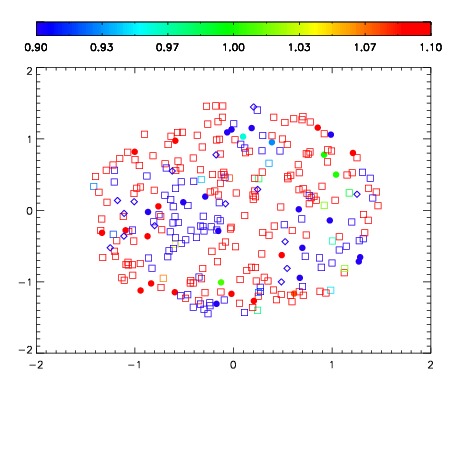


| Frame | Nreads | Zeropoints | Mag plots | Spatial mag deviation | Spatial sky 16325A emission deviations (filled: sky, open: star) | Spatial sky continuum emission | Spatial sky telluric CO2 absorption deviations (filled: H < 10) | |||||||||||||||||||||||
| 0 | 0 |
|
|
|
|
|
|
| IPAIR | NAME | SHIFT | NEWSHIFT | S/N | NAME | SHIFT | NEWSHIFT | S/N |
| 0 | 18530042 | 0.00000 | 0.00000 | 19.6801 | 18530043 | -0.491858 | 0.491858 | 19.6549 |
| 1 | 18530045 | -0.000179388 | 0.000179388 | 18.8577 | 18530044 | -0.491936 | 0.491936 | 18.7890 |