| Red | Green | Blue | |
| z | 17.64 | ||
| znorm | Inf | ||
| sky | -NaN | -NaN | -NaN |
| S/N | 26.3 | 39.2 | 51.8 |
| S/N(c) | 40.1 | 19.0 | 33.0 |
| SN(E/C) |
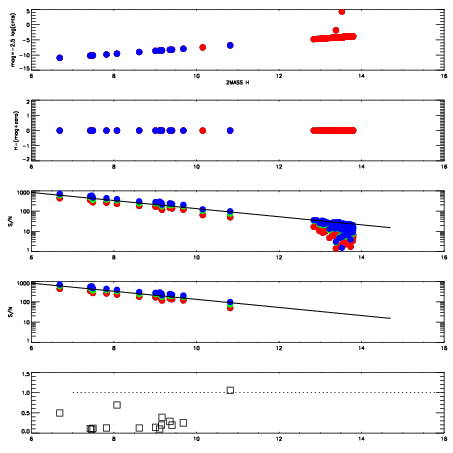
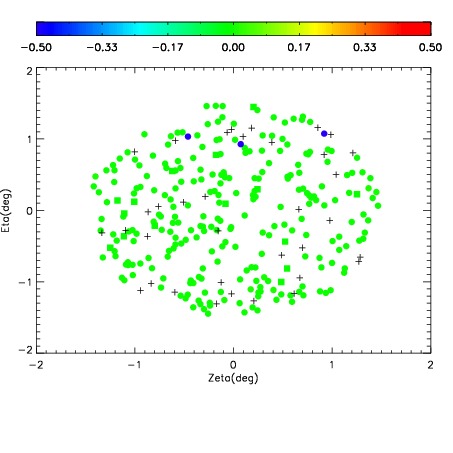
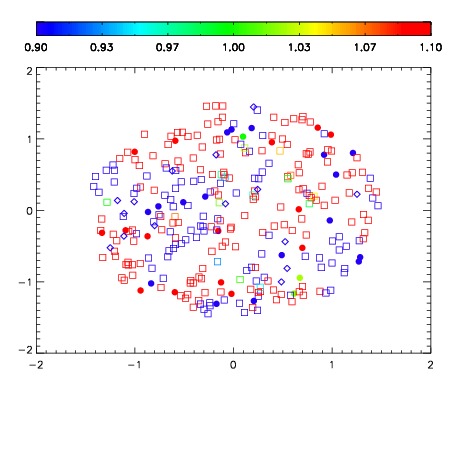
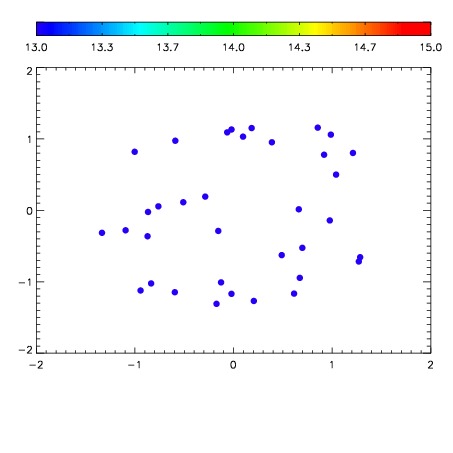

| Frame | Nreads | Zeropoints | Mag plots | Spatial mag deviation | Spatial sky 16325A emission deviations (filled: sky, open: star) | Spatial sky continuum emission | Spatial sky telluric CO2 absorption deviations (filled: H < 10) | |||||||||||||||||||||||
| 0 | 0 |
|
|
|
|
|
|
| IPAIR | NAME | SHIFT | NEWSHIFT | S/N | NAME | SHIFT | NEWSHIFT | S/N |
| 0 | 18560051 | 0.000714410 | 0.00000 | 18.7280 | 18560045 | -0.494272 | 0.494986 | 18.6960 |
| 1 | 18560050 | -0.000244258 | 0.000958668 | 18.8069 | 18560048 | -0.492532 | 0.493246 | 18.8088 |
| 2 | 18560046 | -0.000441946 | 0.00115636 | 18.7599 | 18560049 | -0.492896 | 0.493610 | 18.7990 |
| 3 | 18560047 | -0.000745146 | 0.00145956 | 18.6445 | 18560044 | -0.494365 | 0.495079 | 18.6764 |
| 4 | 18560043 | 0.00000 | 0.000714410 | 18.6022 | 18560052 | -0.492683 | 0.493397 | 18.6410 |