| Red | Green | Blue | |
| z | 17.63 | ||
| znorm | Inf | ||
| sky | -NaN | -NaN | -NaN |
| S/N | 30.9 | 46.1 | 61.0 |
| S/N(c) | 17.2 | 69.8 | 40.9 |
| SN(E/C) |
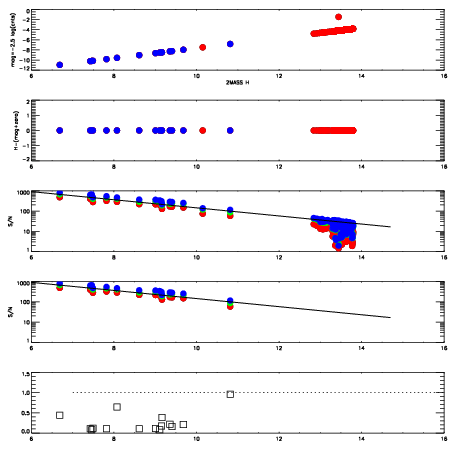
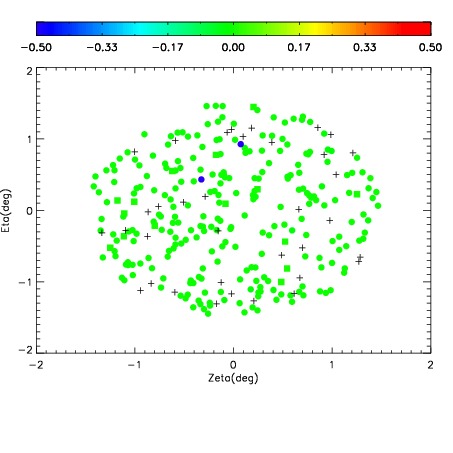

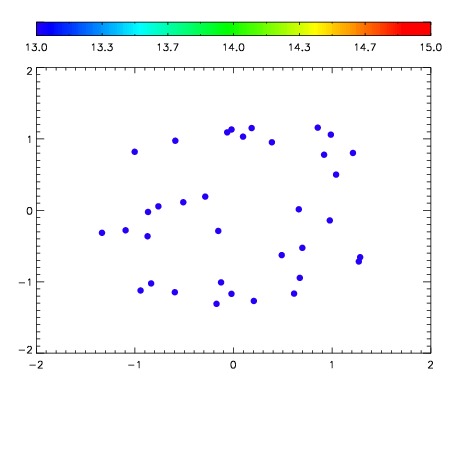

| Frame | Nreads | Zeropoints | Mag plots | Spatial mag deviation | Spatial sky 16325A emission deviations (filled: sky, open: star) | Spatial sky continuum emission | Spatial sky telluric CO2 absorption deviations (filled: H < 10) | |||||||||||||||||||||||
| 0 | 0 |
|
|
|
|
|
|
| IPAIR | NAME | SHIFT | NEWSHIFT | S/N | NAME | SHIFT | NEWSHIFT | S/N |
| 0 | 18840040 | 0.516601 | 0.00000 | 18.7908 | 18840038 | 0.00000 | 0.516601 | 18.7503 |
| 1 | 18840048 | 0.515980 | 0.000621021 | 18.9670 | 18840049 | -0.00220008 | 0.518801 | 19.0101 |
| 2 | 18840047 | 0.515288 | 0.00131303 | 18.9334 | 18840042 | -0.000217197 | 0.516818 | 18.9354 |
| 3 | 18840043 | 0.514764 | 0.00183702 | 18.8965 | 18840045 | 0.000481119 | 0.516120 | 18.8992 |
| 4 | 18840044 | 0.515071 | 0.00153005 | 18.8382 | 18840041 | -0.000246872 | 0.516848 | 18.8957 |
| 5 | 18840039 | 0.515676 | 0.000925004 | 18.8061 | 18840046 | 0.000650804 | 0.515950 | 18.8547 |