| Red | Green | Blue | |
| z | 17.64 | ||
| znorm | Inf | ||
| sky | -Inf | -Inf | -Inf |
| S/N | 25.5 | 39.5 | 52.2 |
| S/N(c) | 14.7 | 64.8 | 34.9 |
| SN(E/C) |
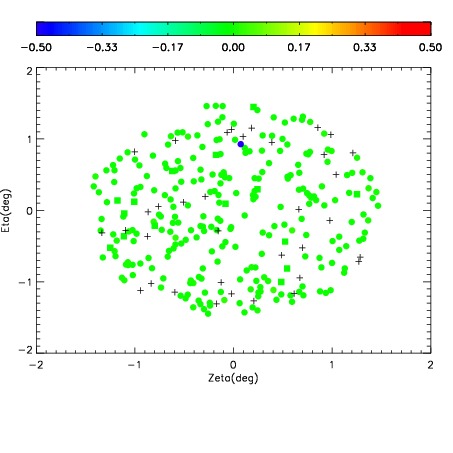
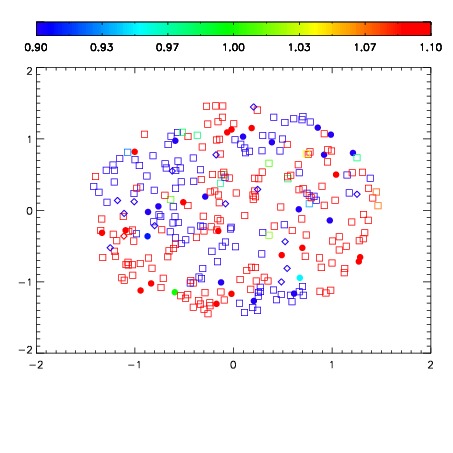


| Frame | Nreads | Zeropoints | Mag plots | Spatial mag deviation | Spatial sky 16325A emission deviations (filled: sky, open: star) | Spatial sky continuum emission | Spatial sky telluric CO2 absorption deviations (filled: H < 10) | |||||||||||||||||||||||
| 0 | 0 |
|
|
|
|
|
|
| IPAIR | NAME | SHIFT | NEWSHIFT | S/N | NAME | SHIFT | NEWSHIFT | S/N |
| 0 | 19400015 | 0.494296 | 0.00000 | 18.8316 | 19400017 | 0.00110204 | 0.493194 | 18.8277 |
| 1 | 19400016 | 0.494108 | 0.000188023 | 18.8573 | 19400018 | 0.000715933 | 0.493580 | 18.8401 |
| 2 | 19400019 | 0.493916 | 0.000380009 | 18.7800 | 19400014 | -0.00113794 | 0.495434 | 18.7910 |
| 3 | 19400020 | 0.493803 | 0.000493020 | 18.6388 | 19400010 | 0.00000 | 0.494296 | 18.6297 |
| 4 | 19400011 | 0.493678 | 0.000618011 | 18.5205 | 19400021 | 0.00425396 | 0.490042 | 18.6014 |
| 5 | 19400012 | 0.492927 | 0.00136900 | 17.8014 | 19400013 | -0.000962547 | 0.495259 | 18.2332 |