| Red | Green | Blue | |
| z | 17.64 | ||
| znorm | Inf | ||
| sky | -Inf | -Inf | -Inf |
| S/N | 28.2 | 48.4 | 56.6 |
| S/N(c) | 24.0 | 30.5 | 156.2 |
| SN(E/C) |
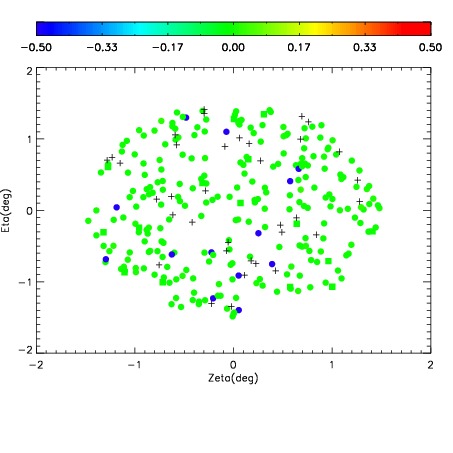
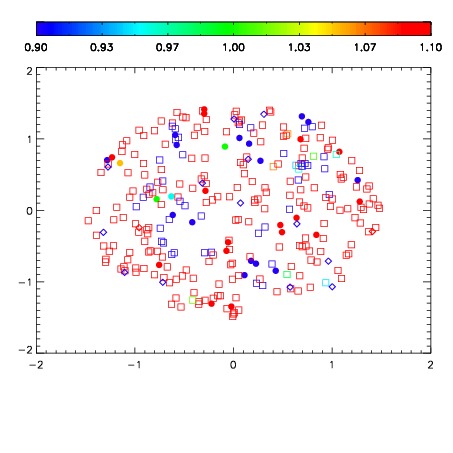
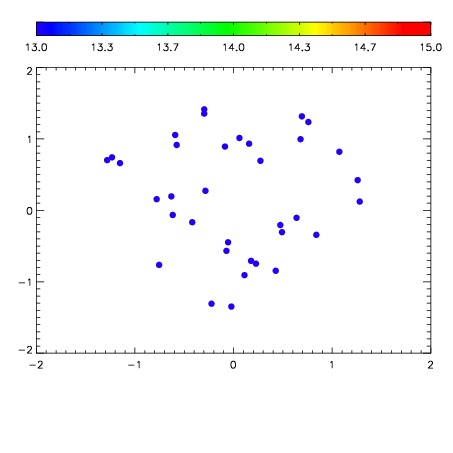

| Frame | Nreads | Zeropoints | Mag plots | Spatial mag deviation | Spatial sky 16325A emission deviations (filled: sky, open: star) | Spatial sky continuum emission | Spatial sky telluric CO2 absorption deviations (filled: H < 10) | |||||||||||||||||||||||
| 0 | 0 |
|
|
|
|
|
|
| IPAIR | NAME | SHIFT | NEWSHIFT | S/N | NAME | SHIFT | NEWSHIFT | S/N |
| 0 | 18540057 | 0.493222 | 0.00000 | 18.9908 | 18540054 | 0.000459359 | 0.492763 | 19.0257 |
| 1 | 18540053 | 0.491907 | 0.00131500 | 19.0680 | 18540055 | 0.000125776 | 0.493096 | 19.0804 |
| 2 | 18540052 | 0.491323 | 0.00189900 | 19.0536 | 18540051 | 0.00000 | 0.493222 | 19.0445 |
| 3 | 18540056 | 0.492760 | 0.000461996 | 18.9744 | 18540058 | -0.000128899 | 0.493351 | 18.9078 |