| Red | Green | Blue | |
| z | 17.64 | ||
| znorm | Inf | ||
| sky | -Inf | -Inf | -Inf |
| S/N | 41.7 | 64.5 | 74.3 |
| S/N(c) | 33.2 | 52.6 | 53.0 |
| SN(E/C) |
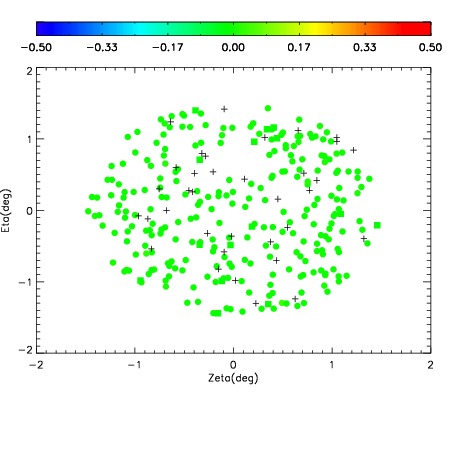
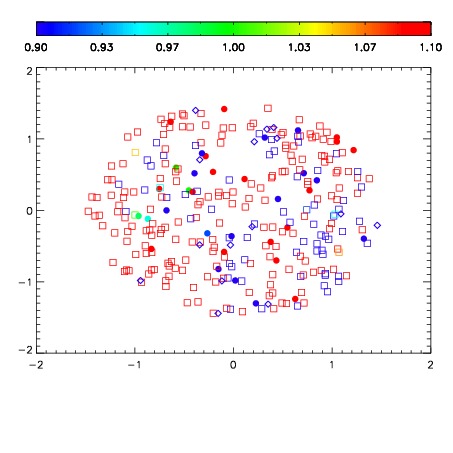
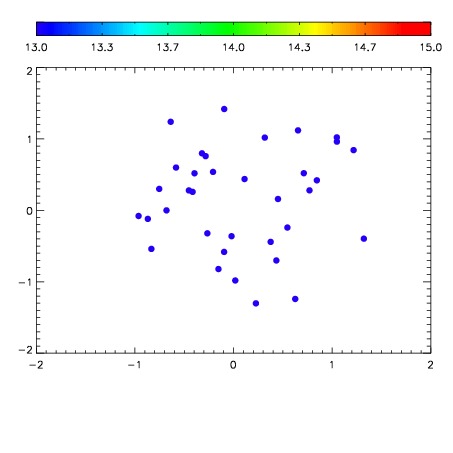

| Frame | Nreads | Zeropoints | Mag plots | Spatial mag deviation | Spatial sky 16325A emission deviations (filled: sky, open: star) | Spatial sky continuum emission | Spatial sky telluric CO2 absorption deviations (filled: H < 10) | |||||||||||||||||||||||
| 0 | 0 |
|
|
|
|
|
|
| IPAIR | NAME | SHIFT | NEWSHIFT | S/N | NAME | SHIFT | NEWSHIFT | S/N |
| 0 | 18490079 | 0.503479 | 0.00000 | 19.1262 | 18490080 | -0.00101145 | 0.504490 | 19.1177 |
| 1 | 18490078 | 0.503048 | 0.000431001 | 19.1125 | 18490077 | 0.000129780 | 0.503349 | 19.1010 |
| 2 | 18490075 | 0.502245 | 0.00123399 | 19.0349 | 18490076 | 0.000453799 | 0.503025 | 19.0875 |
| 3 | 18490074 | 0.501635 | 0.00184399 | 18.9889 | 18490073 | -0.000205061 | 0.503684 | 19.0000 |
| 4 | 18490071 | 0.503304 | 0.000174999 | 18.1023 | 18490072 | 0.000221440 | 0.503258 | 18.6649 |
| 5 | 18490070 | 0.503079 | 0.000400007 | 17.9021 | 18490069 | 0.00000 | 0.503479 | 16.7939 |