| Red | Green | Blue | |
| z | 17.65 | ||
| znorm | Inf | ||
| sky | -Inf | -Inf | -Inf |
| S/N | 26.6 | 39.8 | 48.9 |
| S/N(c) | 21.9 | 25.5 | 68.4 |
| SN(E/C) |
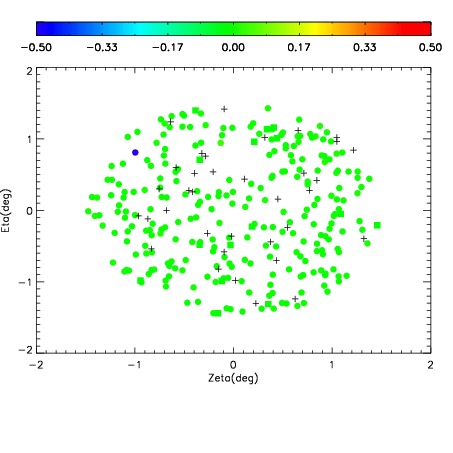
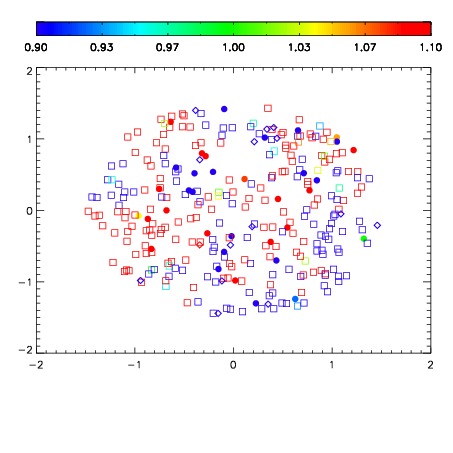
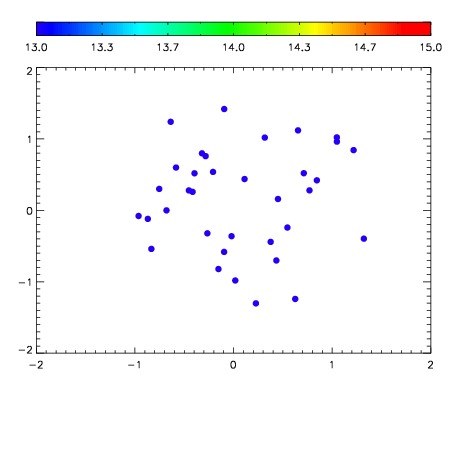

| Frame | Nreads | Zeropoints | Mag plots | Spatial mag deviation | Spatial sky 16325A emission deviations (filled: sky, open: star) | Spatial sky continuum emission | Spatial sky telluric CO2 absorption deviations (filled: H < 10) | |||||||||||||||||||||||
| 0 | 0 |
|
|
|
|
|
|
| IPAIR | NAME | SHIFT | NEWSHIFT | S/N | NAME | SHIFT | NEWSHIFT | S/N |
| 0 | 18520054 | 0.496679 | 0.00000 | 18.8353 | 18520053 | 0.00215030 | 0.494529 | 18.8680 |
| 1 | 18520051 | 0.496571 | 0.000108004 | 18.9034 | 18520052 | 0.00267099 | 0.494008 | 18.9477 |
| 2 | 18520050 | 0.494883 | 0.00179601 | 18.8837 | 18520049 | 0.00000 | 0.496679 | 18.8806 |