| Red | Green | Blue | |
| z | 17.64 | ||
| znorm | Inf | ||
| sky | -Inf | -NaN | -NaN |
| S/N | 34.1 | 48.4 | 61.2 |
| S/N(c) | 20.5 | 36.6 | 0.6 |
| SN(E/C) |
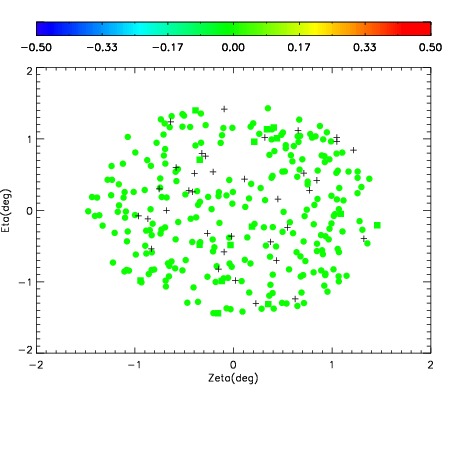
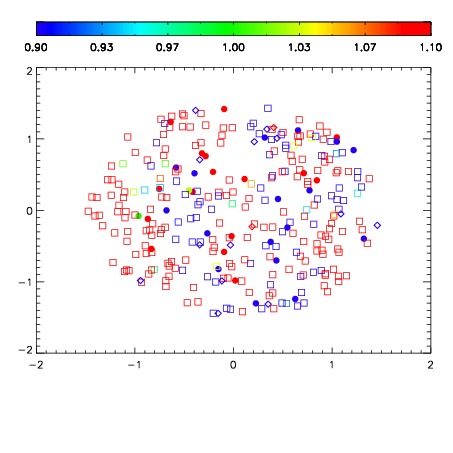
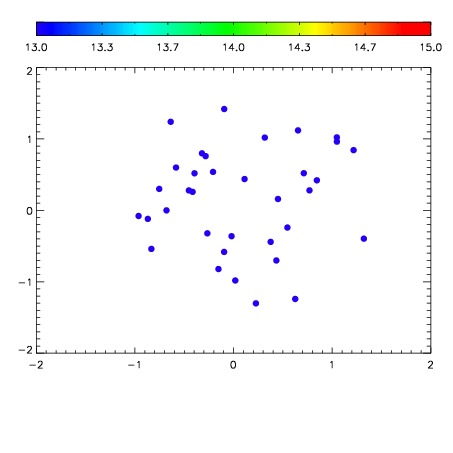

| Frame | Nreads | Zeropoints | Mag plots | Spatial mag deviation | Spatial sky 16325A emission deviations (filled: sky, open: star) | Spatial sky continuum emission | Spatial sky telluric CO2 absorption deviations (filled: H < 10) | |||||||||||||||||||||||
| 0 | 0 |
|
|
|
|
|
|
| IPAIR | NAME | SHIFT | NEWSHIFT | S/N | NAME | SHIFT | NEWSHIFT | S/N |
| 0 | 18550043 | 0.493379 | 0.00000 | 19.0193 | 18550038 | 0.00000 | 0.493379 | 18.9904 |
| 1 | 18550040 | 0.491140 | 0.00223899 | 19.0594 | 18550045 | -0.000261031 | 0.493640 | 19.0032 |
| 2 | 18550044 | 0.491923 | 0.00145599 | 19.0173 | 18550041 | -0.00205790 | 0.495437 | 18.9890 |
| 3 | 18550039 | 0.489726 | 0.00365299 | 18.9985 | 18550042 | -0.00150871 | 0.494888 | 18.9831 |