| Red | Green | Blue | |
| z | 17.65 | ||
| znorm | Inf | ||
| sky | -Inf | -Inf | -NaN |
| S/N | 37.4 | 56.7 | 67.1 |
| S/N(c) | 22.8 | 42.3 | 58.4 |
| SN(E/C) |
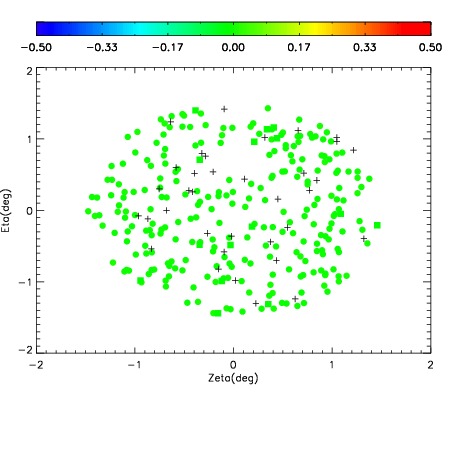
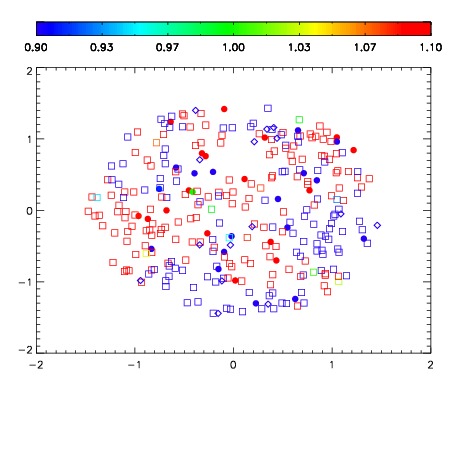
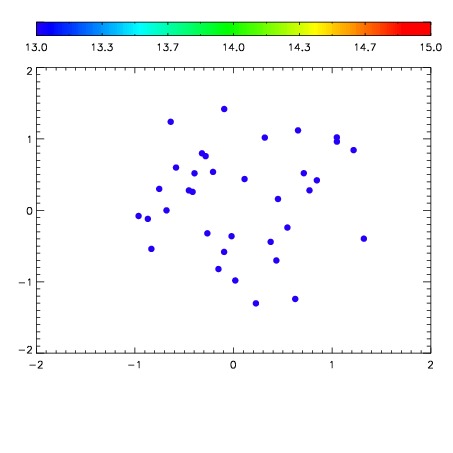

| Frame | Nreads | Zeropoints | Mag plots | Spatial mag deviation | Spatial sky 16325A emission deviations (filled: sky, open: star) | Spatial sky continuum emission | Spatial sky telluric CO2 absorption deviations (filled: H < 10) | |||||||||||||||||||||||
| 0 | 0 |
|
|
|
|
|
|
| IPAIR | NAME | SHIFT | NEWSHIFT | S/N | NAME | SHIFT | NEWSHIFT | S/N |
| 0 | 19020041 | 0.501530 | 0.00000 | 19.1218 | 19020040 | 0.00000 | 0.501530 | 19.1258 |
| 1 | 19020046 | 0.500931 | 0.000598967 | 19.1514 | 19020044 | 8.57885e-05 | 0.501444 | 19.1408 |
| 2 | 19020045 | 0.500645 | 0.000885010 | 19.1193 | 19020043 | 0.000295708 | 0.501234 | 19.1253 |
| 3 | 19020042 | 0.501488 | 4.20213e-05 | 19.1040 | 19020047 | 0.000644375 | 0.500886 | 19.0573 |