| Red | Green | Blue | |
| z | 17.64 | ||
| znorm | Inf | ||
| sky | -Inf | -Inf | -Inf |
| S/N | 26.9 | 38.2 | 51.0 |
| S/N(c) | 22.2 | 37.9 | 49.2 |
| SN(E/C) |
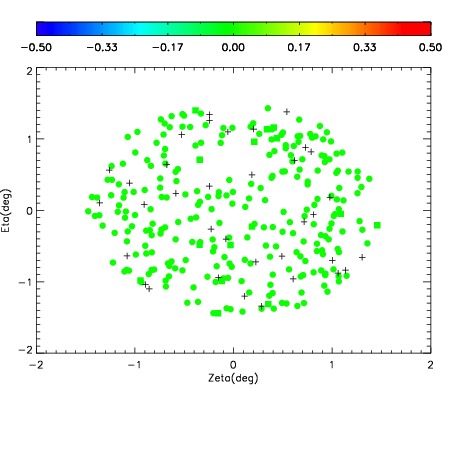

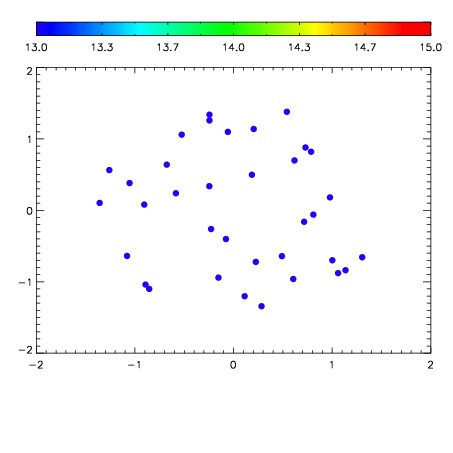

| Frame | Nreads | Zeropoints | Mag plots | Spatial mag deviation | Spatial sky 16325A emission deviations (filled: sky, open: star) | Spatial sky continuum emission | Spatial sky telluric CO2 absorption deviations (filled: H < 10) | |||||||||||||||||||||||
| 0 | 0 |
|
|
|
|
|
|
| IPAIR | NAME | SHIFT | NEWSHIFT | S/N | NAME | SHIFT | NEWSHIFT | S/N |
| 0 | 18520043 | 0.497019 | 0.00000 | 18.7286 | 18520040 | 0.00157580 | 0.495443 | 18.7352 |
| 1 | 18520039 | 0.495979 | 0.00103998 | 18.7171 | 18520041 | 0.00117577 | 0.495843 | 18.6879 |
| 2 | 18520042 | 0.496355 | 0.000663996 | 18.6668 | 18520044 | 0.00307494 | 0.493944 | 18.6749 |
| 3 | 18520038 | 0.494802 | 0.00221699 | 18.6294 | 18520037 | 0.00000 | 0.497019 | 18.6241 |