| Red | Green | Blue | |
| z | 17.64 | ||
| znorm | Inf | ||
| sky | -Inf | -Inf | -Inf |
| S/N | 35.4 | 50.9 | 63.5 |
| S/N(c) | 27.2 | 30.5 | 53.9 |
| SN(E/C) |
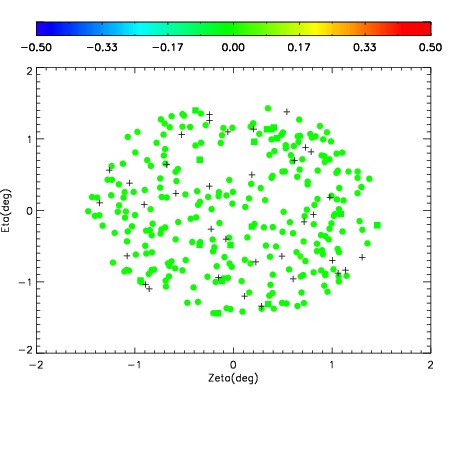
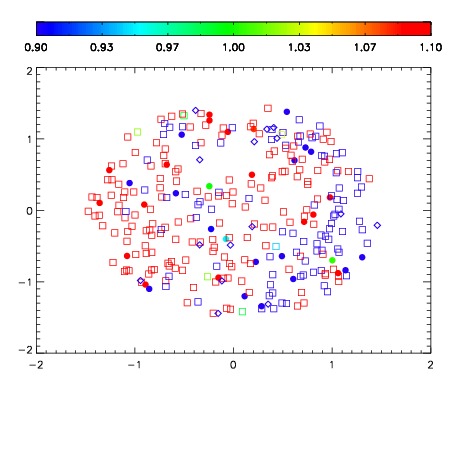
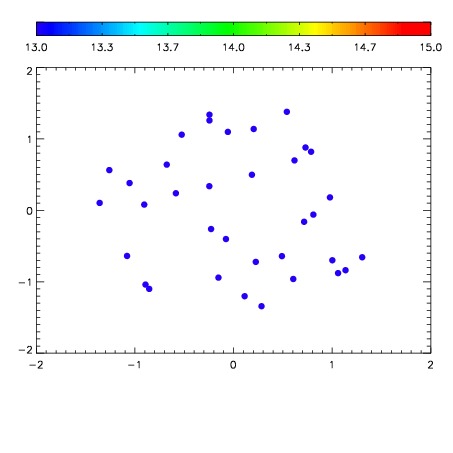

| Frame | Nreads | Zeropoints | Mag plots | Spatial mag deviation | Spatial sky 16325A emission deviations (filled: sky, open: star) | Spatial sky continuum emission | Spatial sky telluric CO2 absorption deviations (filled: H < 10) | |||||||||||||||||||||||
| 0 | 0 |
|
|
|
|
|
|
| IPAIR | NAME | SHIFT | NEWSHIFT | S/N | NAME | SHIFT | NEWSHIFT | S/N |
| 0 | 19040045 | 0.00576419 | 0.00000 | 18.8978 | 19040044 | -0.498574 | 0.504338 | 18.9295 |
| 1 | 19040038 | 0.00000 | 0.00576419 | 19.0542 | 19040039 | -0.497029 | 0.502793 | 19.0352 |
| 2 | 19040042 | 0.00280933 | 0.00295486 | 18.9855 | 19040043 | -0.498354 | 0.504118 | 19.0311 |
| 3 | 19040041 | 0.00246405 | 0.00330014 | 18.9531 | 19040040 | -0.497207 | 0.502971 | 18.9873 |