| Red | Green | Blue | |
| z | 17.64 | ||
| znorm | Inf | ||
| sky | -Inf | -Inf | -Inf |
| S/N | 33.9 | 49.8 | 62.9 |
| S/N(c) | 19.6 | 36.7 | 0.6 |
| SN(E/C) |
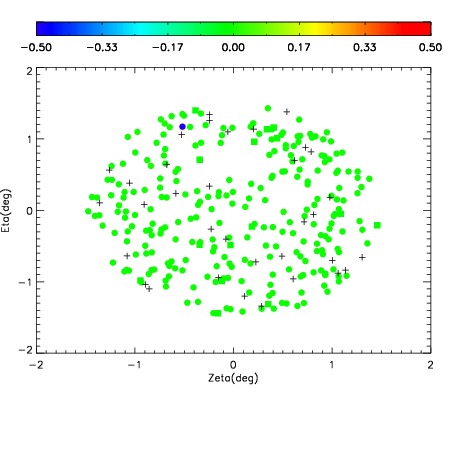
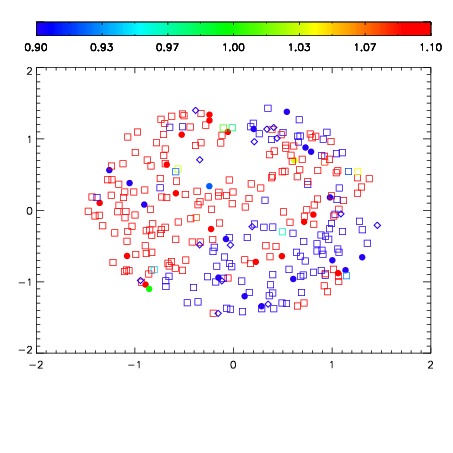
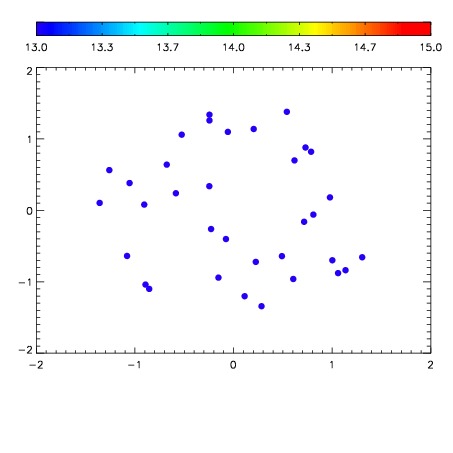

| Frame | Nreads | Zeropoints | Mag plots | Spatial mag deviation | Spatial sky 16325A emission deviations (filled: sky, open: star) | Spatial sky continuum emission | Spatial sky telluric CO2 absorption deviations (filled: H < 10) | |||||||||||||||||||||||
| 0 | 0 |
|
|
|
|
|
|
| IPAIR | NAME | SHIFT | NEWSHIFT | S/N | NAME | SHIFT | NEWSHIFT | S/N |
| 0 | 19140032 | 0.00000 | 0.00000 | 18.6235 | 19140033 | -0.506474 | 0.506474 | 18.8402 |
| 1 | 19140036 | -0.00187582 | 0.00187582 | 18.9396 | 19140037 | -0.505447 | 0.505447 | 18.9023 |
| 2 | 19140035 | -0.00194470 | 0.00194470 | 18.9277 | 19140034 | -0.506758 | 0.506758 | 18.8987 |
| 3 | 19140039 | -0.00287314 | 0.00287314 | 18.8169 | 19140038 | -0.505847 | 0.505847 | 18.8417 |