| Red | Green | Blue | |
| z | 17.64 | ||
| znorm | Inf | ||
| sky | -Inf | -Inf | -Inf |
| S/N | 23.4 | 34.4 | 43.4 |
| S/N(c) | 18.1 | 20.3 | 0.4 |
| SN(E/C) |
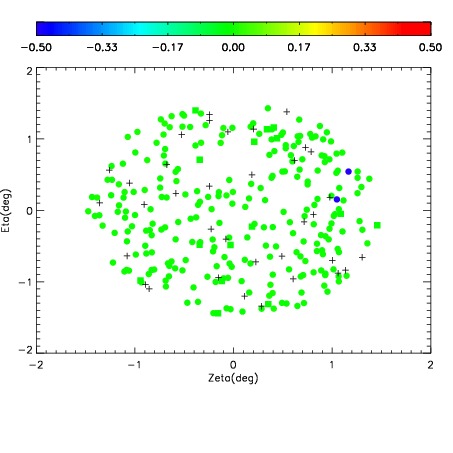
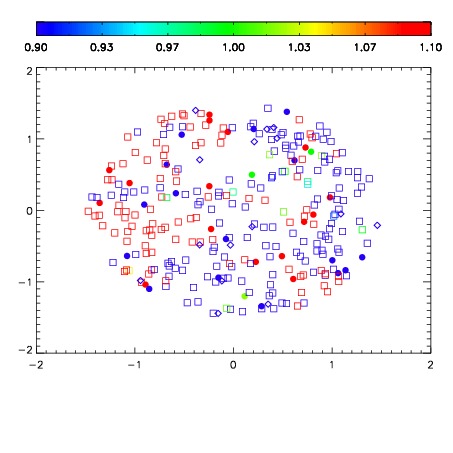
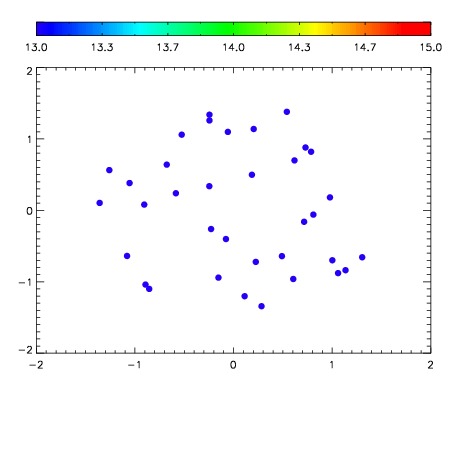

| Frame | Nreads | Zeropoints | Mag plots | Spatial mag deviation | Spatial sky 16325A emission deviations (filled: sky, open: star) | Spatial sky continuum emission | Spatial sky telluric CO2 absorption deviations (filled: H < 10) | |||||||||||||||||||||||
| 0 | 0 |
|
|
|
|
|
|
| IPAIR | NAME | SHIFT | NEWSHIFT | S/N | NAME | SHIFT | NEWSHIFT | S/N |
| 0 | 19330015 | 0.493051 | 0.00000 | 18.8725 | 19330016 | -0.00546533 | 0.498516 | 18.9271 |
| 1 | 19330014 | 0.492629 | 0.000422001 | 18.8678 | 19330013 | 0.00000 | 0.493051 | 18.8160 |