| Red | Green | Blue | |
| z | 17.65 | ||
| znorm | Inf | ||
| sky | -Inf | -Inf | -Inf |
| S/N | 26.3 | 37.6 | 47.4 |
| S/N(c) | 19.1 | 22.0 | 42.3 |
| SN(E/C) |
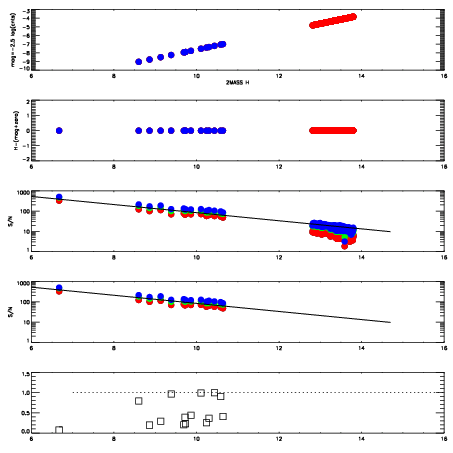
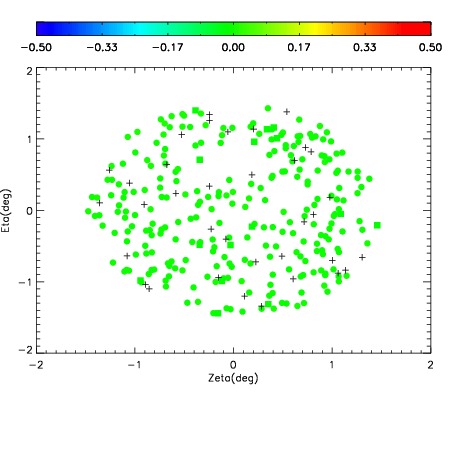
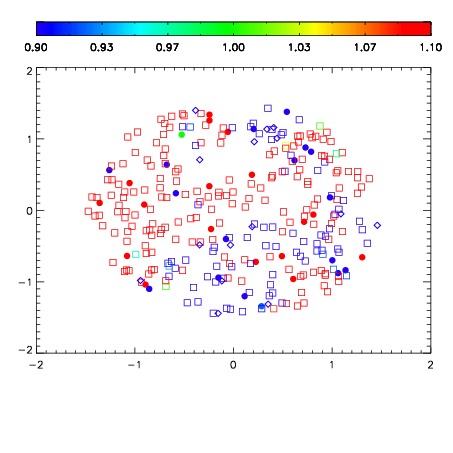
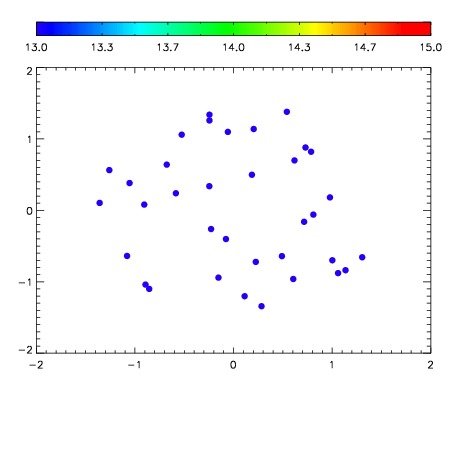

| Frame | Nreads | Zeropoints | Mag plots | Spatial mag deviation | Spatial sky 16325A emission deviations (filled: sky, open: star) | Spatial sky continuum emission | Spatial sky telluric CO2 absorption deviations (filled: H < 10) | |||||||||||||||||||||||
| 0 | 0 |
|
|
|
|
|
|
| IPAIR | NAME | SHIFT | NEWSHIFT | S/N | NAME | SHIFT | NEWSHIFT | S/N |
| 0 | 19360027 | 0.00000 | 0.00000 | 19.0314 | 19360028 | -0.486936 | 0.486936 | 18.9875 |
| 1 | 19360030 | -0.000387388 | 0.000387388 | 19.1265 | 19360029 | -0.486830 | 0.486830 | 19.1009 |