| Frame | Nreads | Zeropoints | Mag plots
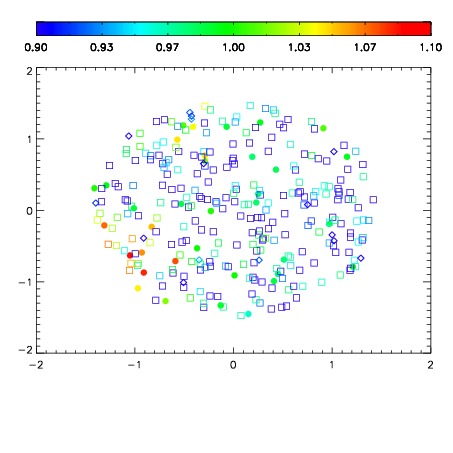
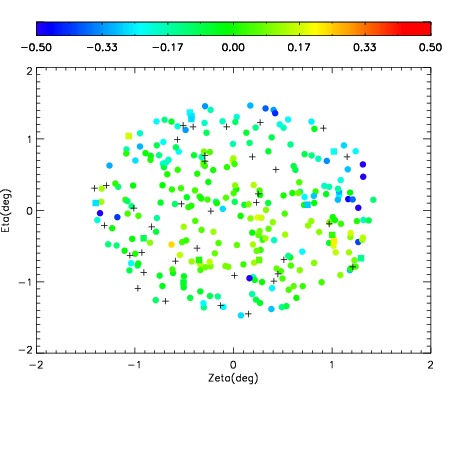
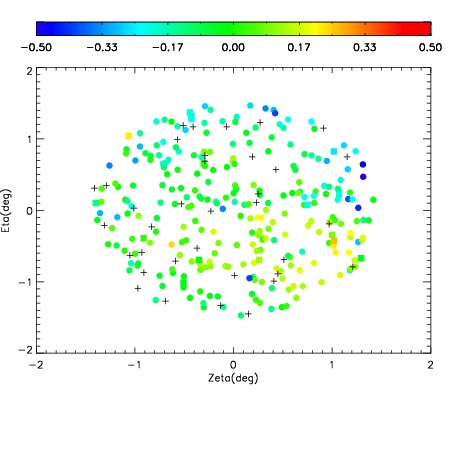
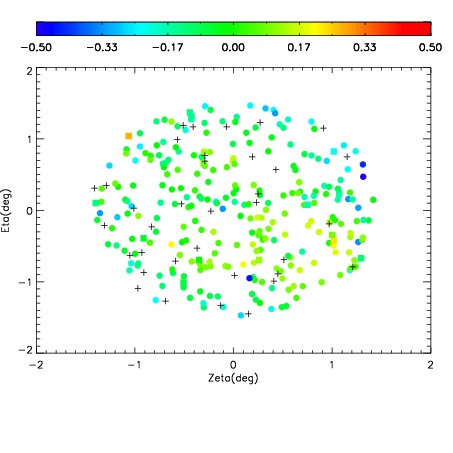
| Spatial mag deviation
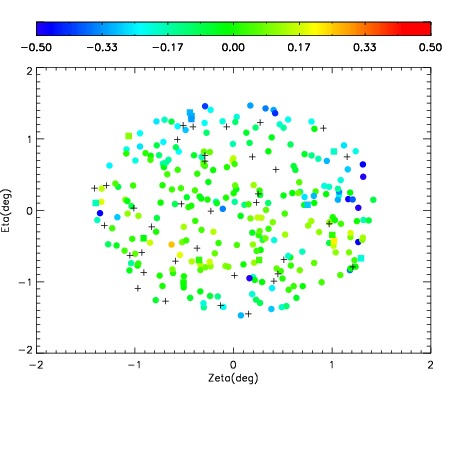
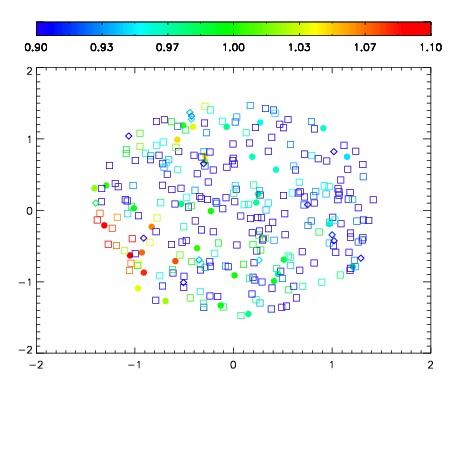
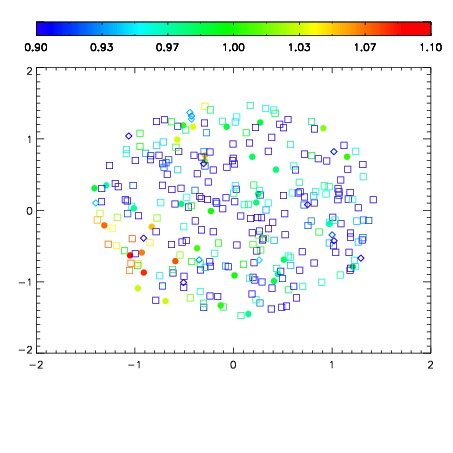
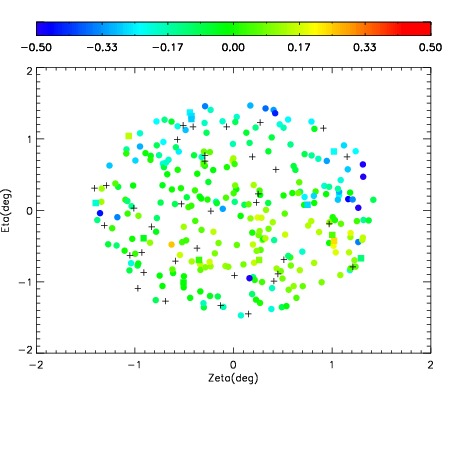
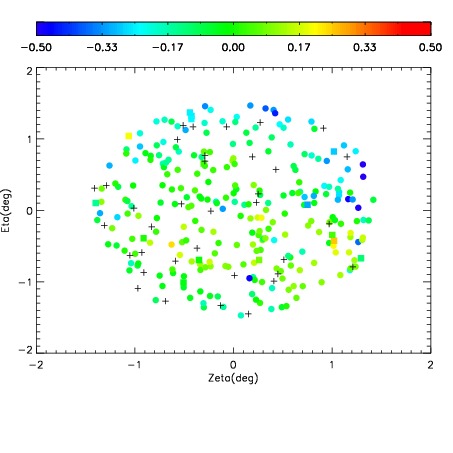
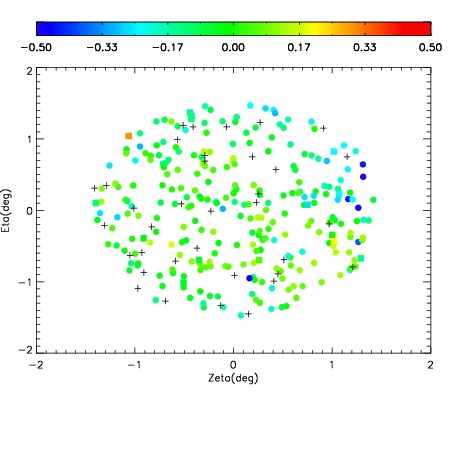
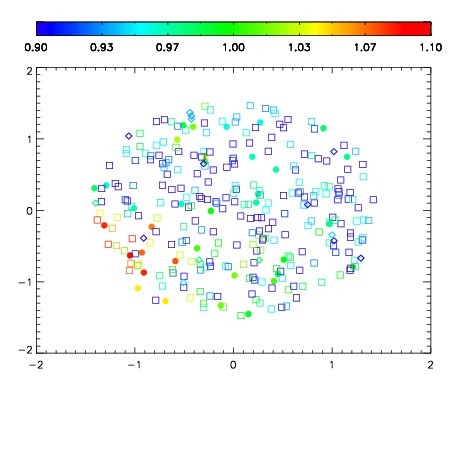
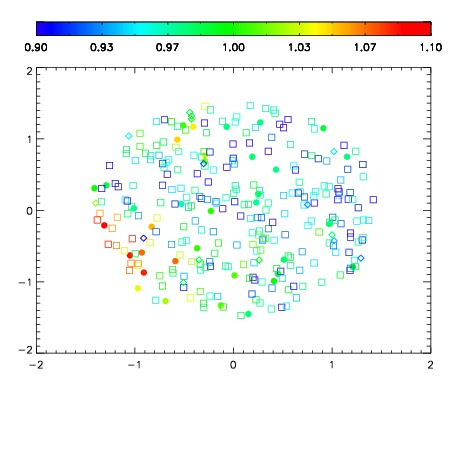
| Spatial sky 16325A emission deviations (filled: sky, open: star)
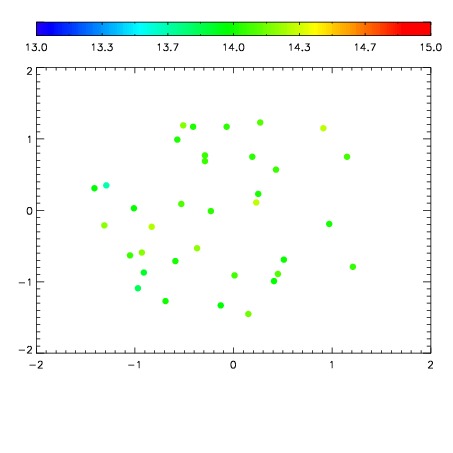
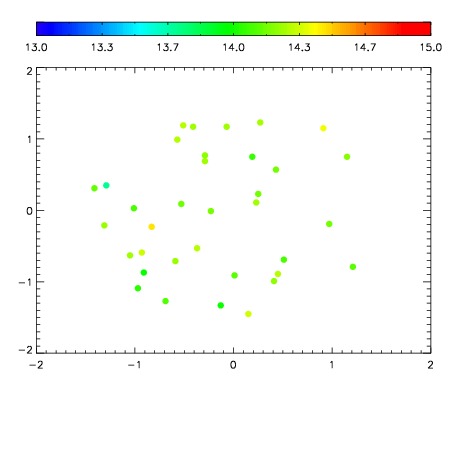
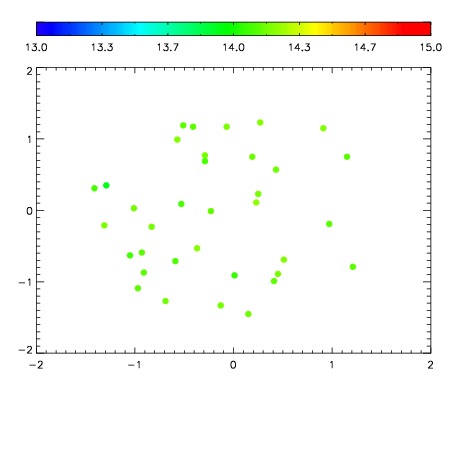
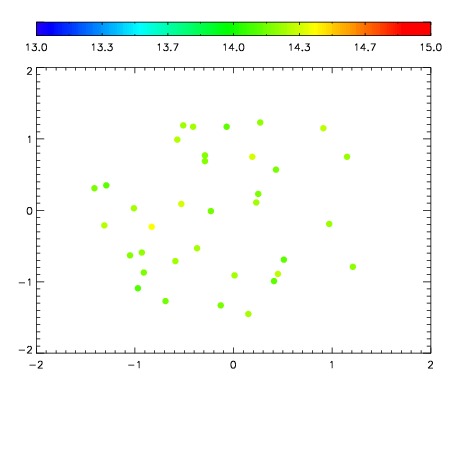
| Spatial sky continuum emission
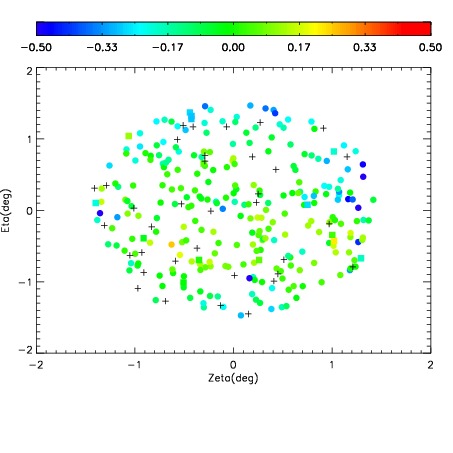
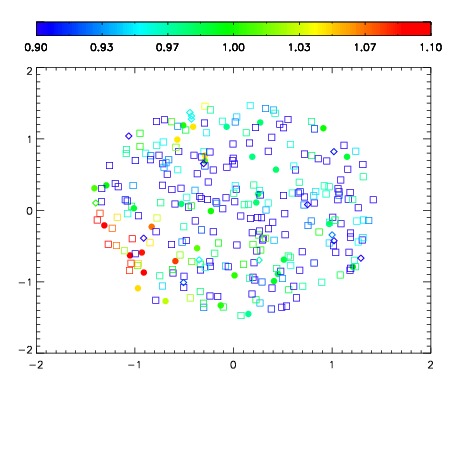
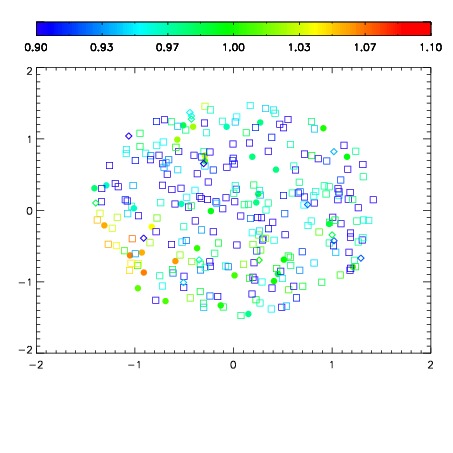
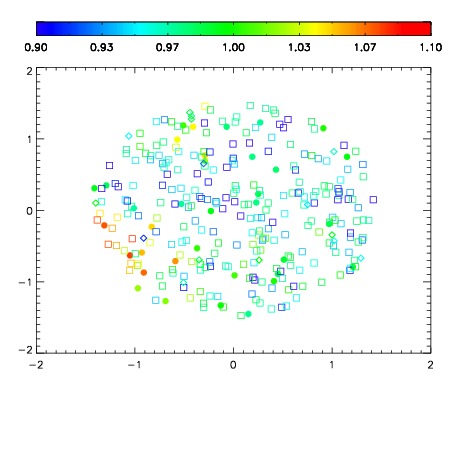
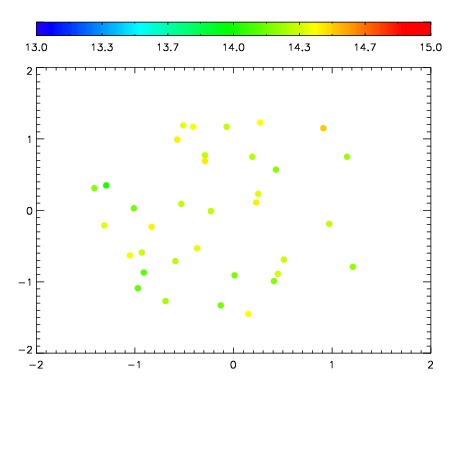
| Spatial sky telluric CO2 absorption deviations (filled: H < 10)
|
| 18150068
| 47
| | Red | Green | Blue
| | z | | 18.79
| | znorm | | 14.61
| | sky | 14.2 | 14.1 | 14.3
| | S/N | 14.1 | 21.8 | 26.7
| | S/N(c) | 51.3 | 17.6 | 17.3
| | SN(E/C) 0.85
|
| 
| 
| 
| 
| 
|
| 18150069
| 47
| | Red | Green | Blue
| | z | | 18.72
| | znorm | | 14.54
| | sky | 14.5 | 14.2 | 14.2
| | S/N | 13.2 | 21.4 | 25.7
| | S/N(c) | 49.7 | 17.2 | 16.7
| | SN(E/C) 0.94
|
| 
| 
| 
| 
| 
|
| 18150070
| 47
| | Red | Green | Blue
| | z | | 18.75
| | znorm | | 14.56
| | sky | 14.3 | 14.2 | 14.3
| | S/N | 14.1 | 21.9 | 26.4
| | S/N(c) | 50.3 | 17.4 | 16.9
| | SN(E/C) 0.90
|
| 
| 
| 
| 
| 
|
| 18150071
| 47
| | Red | Green | Blue
| | z | | 18.59
| | znorm | | 14.41
| | sky | 14.2 | 14.2 | 14.2
| | S/N | 12.4 | 20.2 | 23.8
| | S/N(c) | 47.3 | 16.3 | 15.7
| | SN(E/C) 0.95
|
| 
| 
| 
| 
| 
|
| 18150072
| 47
| | Red | Green | Blue
| | z | | 18.08
| | znorm | | 13.90
| | sky | 14.4 | 14.2 | 14.2
| | S/N | 8.4 | 14.7 | 16.9
| | S/N(c) | 35.4 | 12.6 | 12.3
| | SN(E/C) 0.92
|
| 
| 
| 
| 
| 
|
| 18150073
| 47
| | Red | Green | Blue
| | z | | 17.13
| | znorm | | 12.94
| | sky | 14.2 | 14.2 | 14.3
| | S/N | 3.5 | 7.4 | 9.0
| | S/N(c) | 20.9 | 8.0 | 7.5
| | SN(E/C) 1.02
|
| 
| 
| 
| 
| 
|
| 18150074
| 47
| | Red | Green | Blue
| | z | | 18.21
| | znorm | | 14.03
| | sky | 14.4 | 14.3 | 14.4
| | S/N | 9.3 | 16.5 | 18.9
| | S/N(c) | 38.9 | 13.6 | 13.1
| | SN(E/C) 0.97
|
| 
| 
| 
| 
| 
|
| 18150075
| 47
| | Red | Green | Blue
| | z | | 17.31
| | znorm | | 13.13
| | sky | 14.3 | 14.2 | 14.2
| | S/N | 4.4 | 8.8 | 10.1
| | S/N(c) | 23.3 | 8.8 | 8.2
| | SN(E/C) 1.03
|
| 
| 
| 
| 
| 
|