| Red | Green | Blue | |
| z | 17.64 | ||
| znorm | Inf | ||
| sky | -Inf | -Inf | -Inf |
| S/N | 19.0 | 31.4 | 38.2 |
| S/N(c) | 0.0 | 0.0 | 0.0 |
| SN(E/C) |
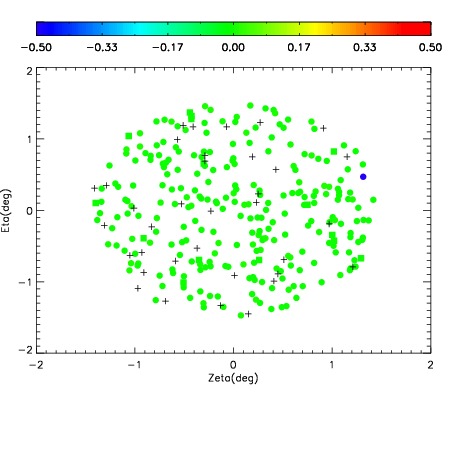
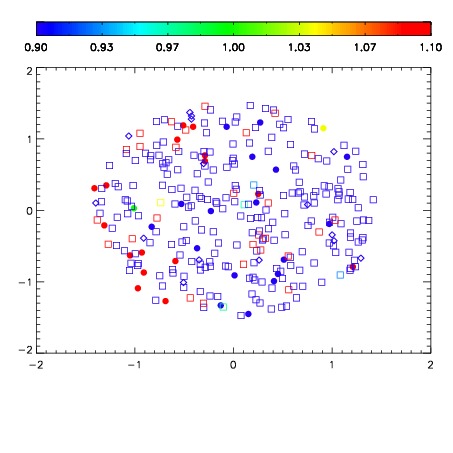
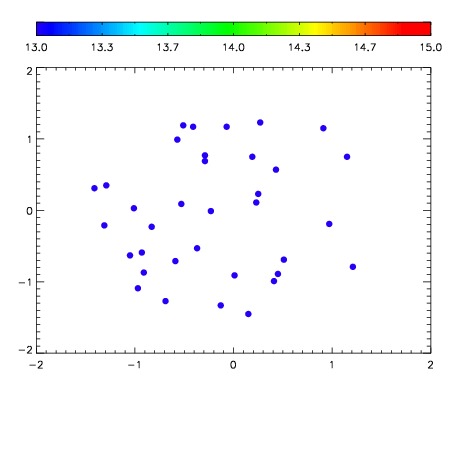

| Frame | Nreads | Zeropoints | Mag plots | Spatial mag deviation | Spatial sky 16325A emission deviations (filled: sky, open: star) | Spatial sky continuum emission | Spatial sky telluric CO2 absorption deviations (filled: H < 10) | |||||||||||||||||||||||
| 0 | 0 |
|
|
|
|
|
|
| IPAIR | NAME | SHIFT | NEWSHIFT | S/N | NAME | SHIFT | NEWSHIFT | S/N |
| 0 | 18150075 | 0.00419318 | 0.00000 | 17.2912 | 18150073 | -0.499314 | 0.503507 | 17.1110 |
| 1 | 18150068 | 0.00000 | 0.00419318 | 18.7828 | 18150070 | -0.493127 | 0.497320 | 18.7187 |
| 2 | 18150071 | 0.00168327 | 0.00250991 | 18.5804 | 18150069 | -0.493215 | 0.497408 | 18.7068 |
| 3 | 18150072 | 0.00226708 | 0.00192610 | 18.0640 | 18150074 | -0.497638 | 0.501831 | 18.2024 |