| Red | Green | Blue | |
| z | 17.64 | ||
| znorm | Inf | ||
| sky | -Inf | -Inf | -Inf |
| S/N | 4.5 | 8.6 | 10.2 |
| S/N(c) | 0.0 | 0.0 | 0.0 |
| SN(E/C) |
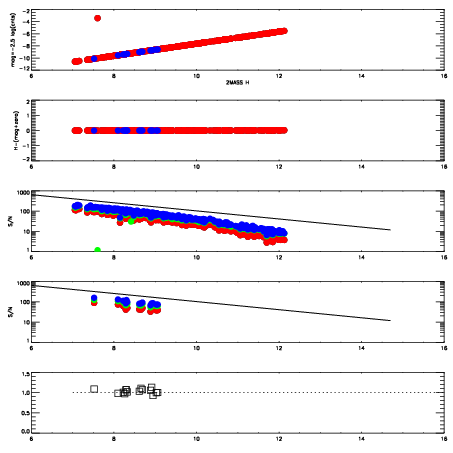
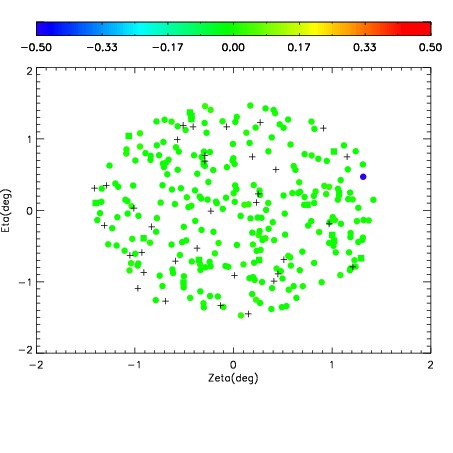
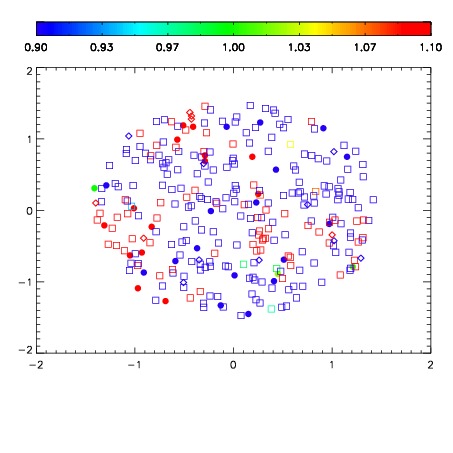


| Frame | Nreads | Zeropoints | Mag plots | Spatial mag deviation | Spatial sky 16325A emission deviations (filled: sky, open: star) | Spatial sky continuum emission | Spatial sky telluric CO2 absorption deviations (filled: H < 10) | |||||||||||||||||||||||
| 0 | 0 |
|
|
|
|
|
|
| IPAIR | NAME | SHIFT | NEWSHIFT | S/N | NAME | SHIFT | NEWSHIFT | S/N |
| 0 | 18440049 | 0.502507 | 0.00000 | 16.1863 | 18440048 | 0.000310128 | 0.502197 | 16.5091 |
| 1 | 18440046 | 0.502096 | 0.000410974 | 16.8893 | 18440044 | 0.00000 | 0.502507 | 17.3513 |
| 2 | 18440045 | 0.502095 | 0.000411987 | 16.8741 | 18440047 | 0.000667417 | 0.501840 | 16.9044 |