| Red | Green | Blue | |
| z | 17.64 | ||
| znorm | Inf | ||
| sky | -Inf | -Inf | -Inf |
| S/N | 21.7 | 39.0 | 44.2 |
| S/N(c) | 0.0 | 0.0 | 0.0 |
| SN(E/C) |
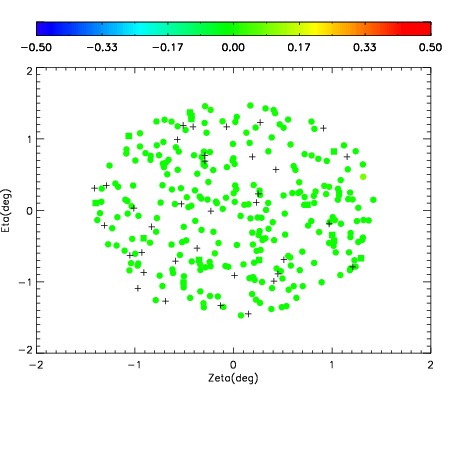
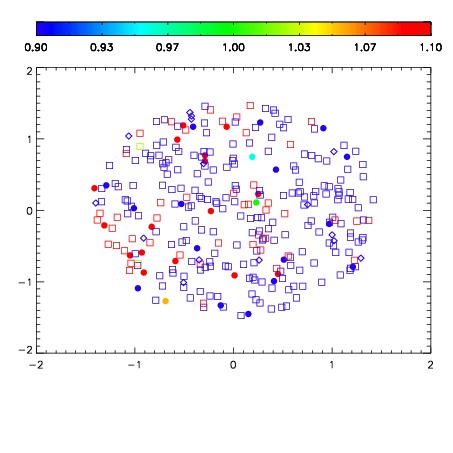
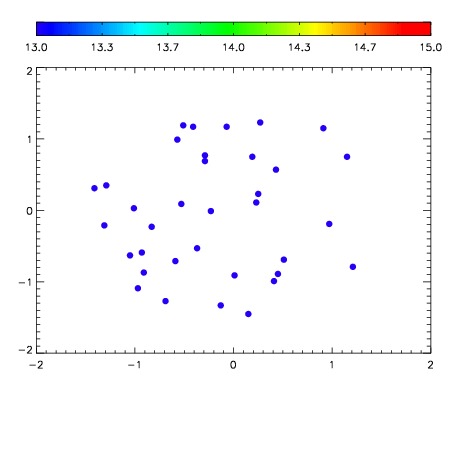

| Frame | Nreads | Zeropoints | Mag plots | Spatial mag deviation | Spatial sky 16325A emission deviations (filled: sky, open: star) | Spatial sky continuum emission | Spatial sky telluric CO2 absorption deviations (filled: H < 10) | |||||||||||||||||||||||
| 0 | 0 |
|
|
|
|
|
|
| IPAIR | NAME | SHIFT | NEWSHIFT | S/N | NAME | SHIFT | NEWSHIFT | S/N |
| 0 | 18500024 | 0.000755251 | 0.00000 | 18.7808 | 18500026 | -0.499533 | 0.500288 | 18.6930 |
| 1 | 18500027 | 0.000163261 | 0.000591990 | 18.7551 | 18500025 | -0.498682 | 0.499437 | 18.6844 |
| 2 | 18500023 | 0.000510580 | 0.000244671 | 18.7034 | 18500022 | -0.499505 | 0.500260 | 18.6669 |
| 3 | 18500020 | 0.00000 | 0.000755251 | 18.6729 | 18500021 | -0.499838 | 0.500593 | 18.5703 |