| Red | Green | Blue | |
| z | 17.64 | ||
| znorm | Inf | ||
| sky | -Inf | -Inf | -Inf |
| S/N | 25.2 | 42.8 | 48.1 |
| S/N(c) | 0.0 | 0.0 | 0.0 |
| SN(E/C) |
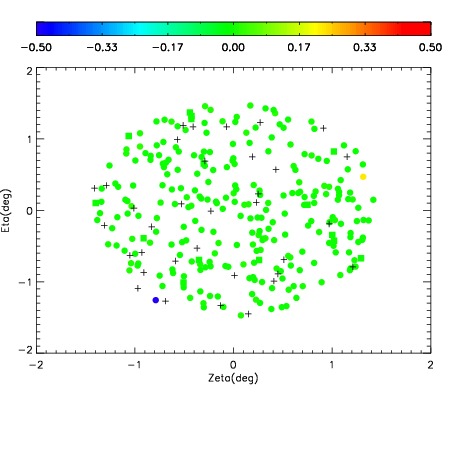
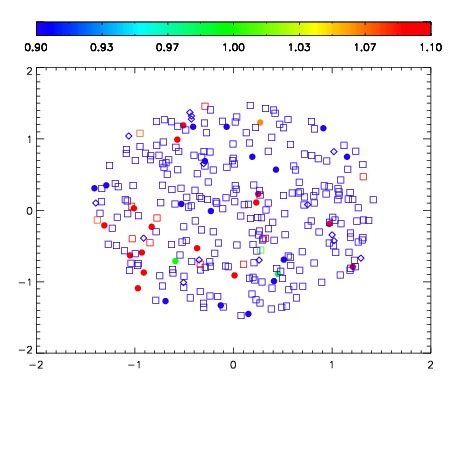
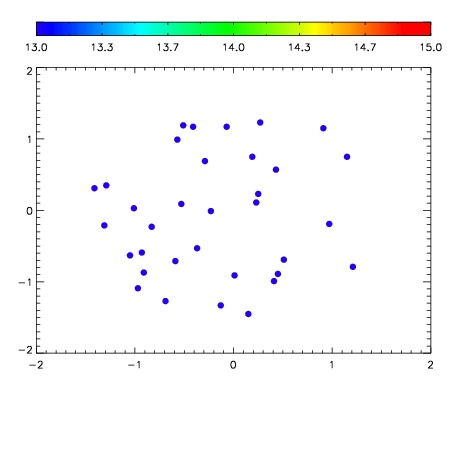

| Frame | Nreads | Zeropoints | Mag plots | Spatial mag deviation | Spatial sky 16325A emission deviations (filled: sky, open: star) | Spatial sky continuum emission | Spatial sky telluric CO2 absorption deviations (filled: H < 10) | |||||||||||||||||||||||
| 0 | 0 |
|
|
|
|
|
|
| IPAIR | NAME | SHIFT | NEWSHIFT | S/N | NAME | SHIFT | NEWSHIFT | S/N |
| 0 | 18530031 | 0.472287 | 0.00000 | 18.8646 | 18530030 | 0.00299761 | 0.469289 | 18.9364 |
| 1 | 18530028 | 0.470714 | 0.00157300 | 18.9626 | 18530029 | 0.00227243 | 0.470015 | 18.9809 |
| 2 | 18530027 | 0.469249 | 0.00303799 | 18.9273 | 18530026 | 0.00000 | 0.472287 | 18.9460 |