| Red | Green | Blue | |
| z | 17.64 | ||
| znorm | Inf | ||
| sky | -Inf | -Inf | -NaN |
| S/N | 28.2 | 47.4 | 55.5 |
| S/N(c) | 0.0 | 0.0 | 0.0 |
| SN(E/C) |
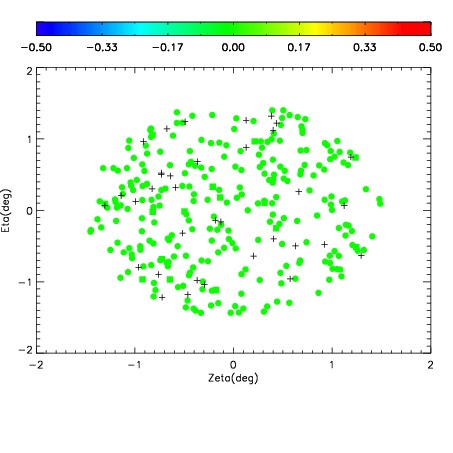
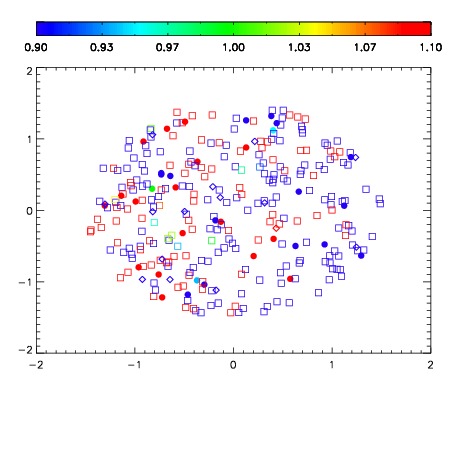


| Frame | Nreads | Zeropoints | Mag plots | Spatial mag deviation | Spatial sky 16325A emission deviations (filled: sky, open: star) | Spatial sky continuum emission | Spatial sky telluric CO2 absorption deviations (filled: H < 10) | |||||||||||||||||||||||
| 0 | 0 |
|
|
|
|
|
|
| IPAIR | NAME | SHIFT | NEWSHIFT | S/N | NAME | SHIFT | NEWSHIFT | S/N |
| 0 | 19030017 | 0.496776 | 0.00000 | 19.1012 | 19030015 | -0.00120398 | 0.497980 | 19.0451 |
| 1 | 19030012 | 0.496099 | 0.000677019 | 19.1526 | 19030011 | 0.00000 | 0.496776 | 19.1189 |
| 2 | 19030013 | 0.496193 | 0.000583023 | 19.1215 | 19030018 | -0.00280927 | 0.499585 | 19.0681 |
| 3 | 19030016 | 0.496013 | 0.000763029 | 19.1005 | 19030014 | -0.00120226 | 0.497978 | 19.0427 |