| Red | Green | Blue | |
| z | 17.64 | ||
| znorm | Inf | ||
| sky | -Inf | -Inf | -NaN |
| S/N | 25.0 | 43.7 | 50.3 |
| S/N(c) | 0.0 | 0.0 | 0.0 |
| SN(E/C) |
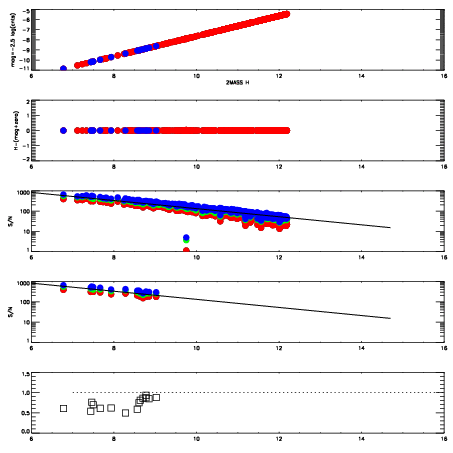
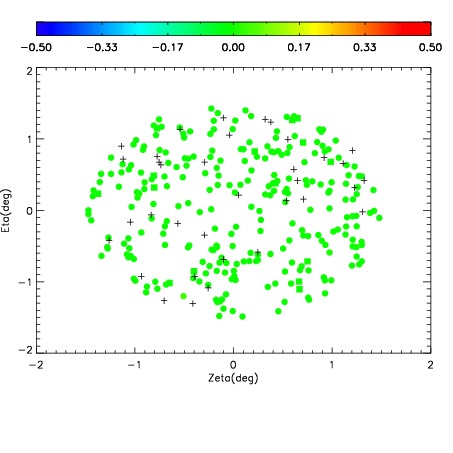
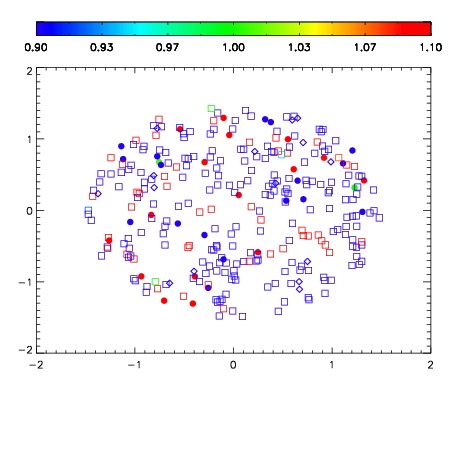
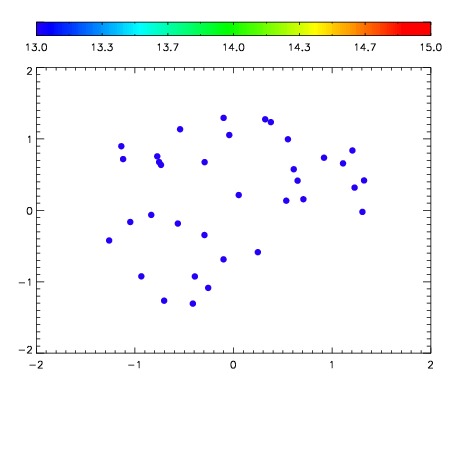

| Frame | Nreads | Zeropoints | Mag plots | Spatial mag deviation | Spatial sky 16325A emission deviations (filled: sky, open: star) | Spatial sky continuum emission | Spatial sky telluric CO2 absorption deviations (filled: H < 10) | |||||||||||||||||||||||
| 0 | 0 |
|
|
|
|
|
|
| IPAIR | NAME | SHIFT | NEWSHIFT | S/N | NAME | SHIFT | NEWSHIFT | S/N |
| 0 | 18480049 | 0.506371 | 0.00000 | 18.7650 | 18480047 | 0.00315169 | 0.503219 | 18.7076 |
| 1 | 18480045 | 0.503638 | 0.00273299 | 18.8897 | 18480043 | 0.00203405 | 0.504337 | 18.9443 |
| 2 | 18480046 | 0.504039 | 0.00233203 | 18.8694 | 18480040 | 0.00000 | 0.506371 | 18.9139 |
| 3 | 18480041 | 0.502504 | 0.00386703 | 18.8614 | 18480044 | 0.00196832 | 0.504403 | 18.8118 |
| 4 | 18480042 | 0.503678 | 0.00269300 | 18.8060 | 18480048 | 0.00355548 | 0.502816 | 18.7312 |