| Red | Green | Blue | |
| z | 17.64 | ||
| znorm | Inf | ||
| sky | -NaN | -NaN | -NaN |
| S/N | 24.5 | 43.0 | 49.3 |
| S/N(c) | 0.0 | 0.0 | 0.0 |
| SN(E/C) |
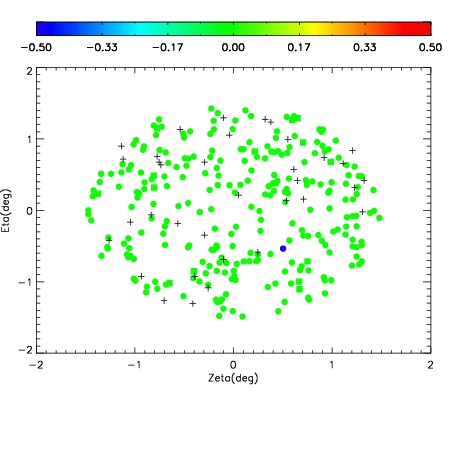
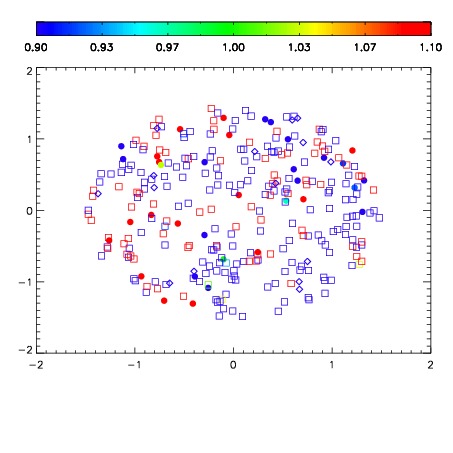
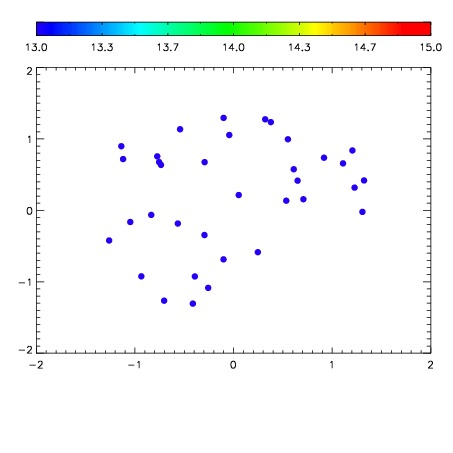

| Frame | Nreads | Zeropoints | Mag plots | Spatial mag deviation | Spatial sky 16325A emission deviations (filled: sky, open: star) | Spatial sky continuum emission | Spatial sky telluric CO2 absorption deviations (filled: H < 10) | |||||||||||||||||||||||
| 0 | 0 |
|
|
|
|
|
|
| IPAIR | NAME | SHIFT | NEWSHIFT | S/N | NAME | SHIFT | NEWSHIFT | S/N |
| 0 | 18810028 | 0.506552 | 0.00000 | 18.9619 | 18810030 | -0.00152064 | 0.508073 | 18.9833 |
| 1 | 18810027 | 0.506168 | 0.000383973 | 19.0288 | 18810026 | 0.00000 | 0.506552 | 19.0143 |
| 2 | 18810031 | 0.505795 | 0.000756979 | 18.9194 | 18810029 | -0.00152210 | 0.508074 | 18.9653 |
| 3 | 18810032 | 0.506368 | 0.000184000 | 18.8838 | 18810033 | 0.00190685 | 0.504645 | 18.8108 |