| Red | Green | Blue | |
| z | 17.64 | ||
| znorm | Inf | ||
| sky | -Inf | -Inf | -Inf |
| S/N | 29.4 | 49.8 | 58.6 |
| S/N(c) | 0.0 | 0.0 | 0.0 |
| SN(E/C) |
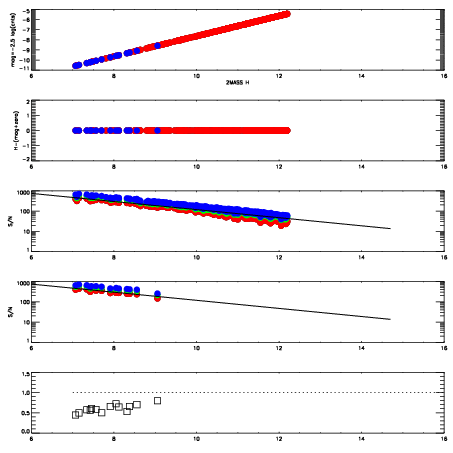
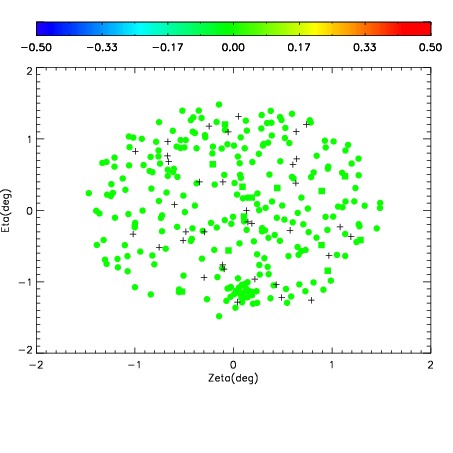
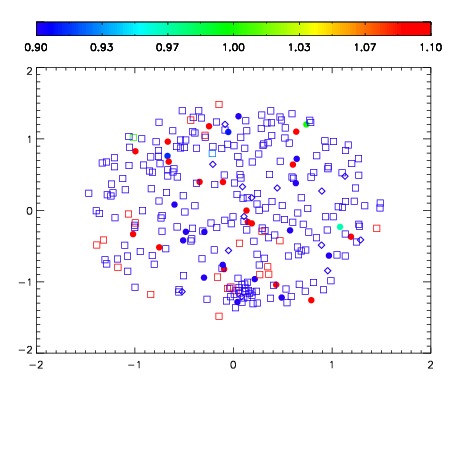
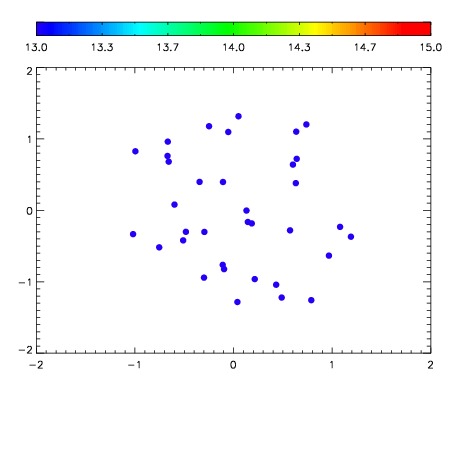

| Frame | Nreads | Zeropoints | Mag plots | Spatial mag deviation | Spatial sky 16325A emission deviations (filled: sky, open: star) | Spatial sky continuum emission | Spatial sky telluric CO2 absorption deviations (filled: H < 10) | |||||||||||||||||||||||
| 0 | 0 |
|
|
|
|
|
|
| IPAIR | NAME | SHIFT | NEWSHIFT | S/N | NAME | SHIFT | NEWSHIFT | S/N |
| 0 | 18130035 | 0.00278900 | 0.00000 | 19.2008 | 18130033 | -0.501853 | 0.504642 | 19.2098 |
| 1 | 18130031 | 0.00000 | 0.00278900 | 19.2180 | 18130032 | -0.502203 | 0.504992 | 19.2254 |
| 2 | 18130034 | 0.00195031 | 0.000838690 | 19.1957 | 18130036 | -0.499838 | 0.502627 | 19.2044 |
| 3 | 18130038 | 0.000596220 | 0.00219278 | 19.1811 | 18130037 | -0.499836 | 0.502625 | 19.1296 |