| Red | Green | Blue | |
| z | 17.64 | ||
| znorm | Inf | ||
| sky | -Inf | -Inf | -NaN |
| S/N | 30.6 | 50.8 | 58.4 |
| S/N(c) | 0.0 | 0.0 | 0.0 |
| SN(E/C) |
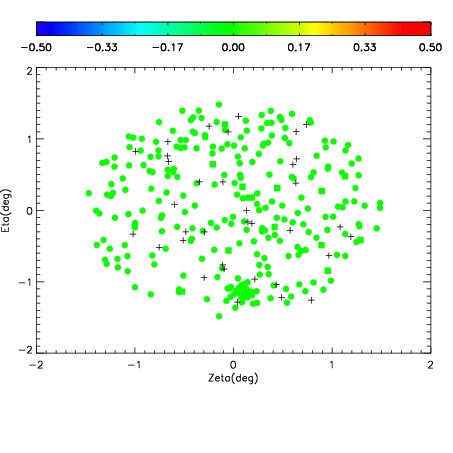
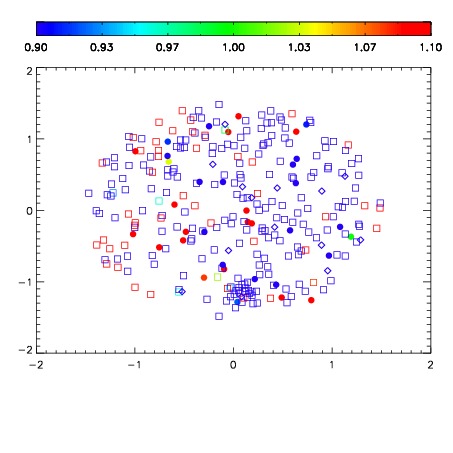
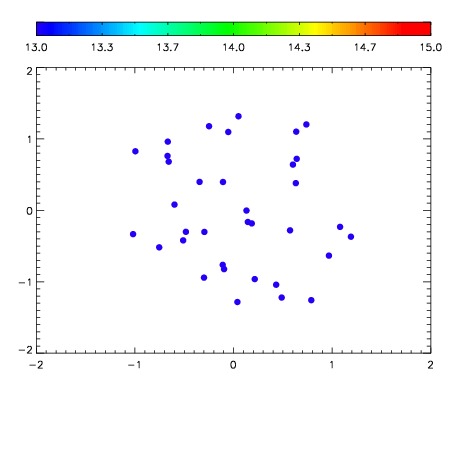

| Frame | Nreads | Zeropoints | Mag plots | Spatial mag deviation | Spatial sky 16325A emission deviations (filled: sky, open: star) | Spatial sky continuum emission | Spatial sky telluric CO2 absorption deviations (filled: H < 10) | |||||||||||||||||||||||
| 0 | 0 |
|
|
|
|
|
|
| IPAIR | NAME | SHIFT | NEWSHIFT | S/N | NAME | SHIFT | NEWSHIFT | S/N |
| 0 | 18160028 | 0.504288 | 0.00000 | 19.0591 | 18160030 | 0.00384926 | 0.500439 | 19.0387 |
| 1 | 18160029 | 0.503807 | 0.000481009 | 19.0698 | 18160031 | 0.00298720 | 0.501301 | 19.1031 |
| 2 | 18160032 | 0.503631 | 0.000657022 | 19.0590 | 18160027 | 0.00217056 | 0.502117 | 18.9740 |
| 3 | 18160024 | 0.503451 | 0.000837028 | 18.8679 | 18160026 | 0.00254411 | 0.501744 | 18.9521 |
| 4 | 18160025 | 0.504252 | 3.60012e-05 | 18.8670 | 18160023 | 0.00000 | 0.504288 | 18.7331 |