| Red | Green | Blue | |
| z | 17.64 | ||
| znorm | Inf | ||
| sky | -Inf | -Inf | -NaN |
| S/N | 15.0 | 26.5 | 30.3 |
| S/N(c) | 0.0 | 0.0 | 0.0 |
| SN(E/C) |
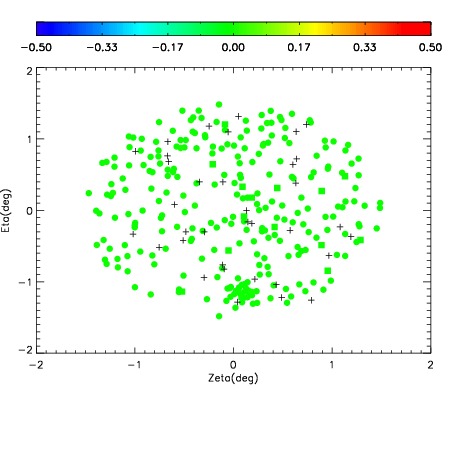
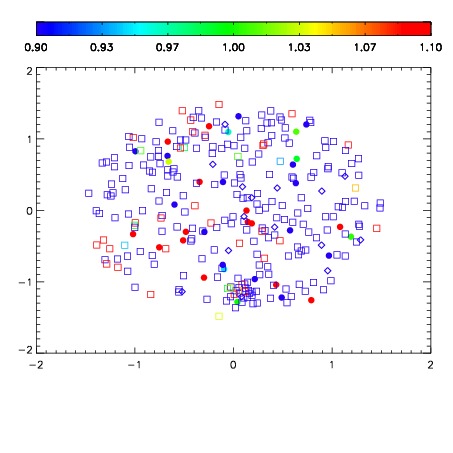
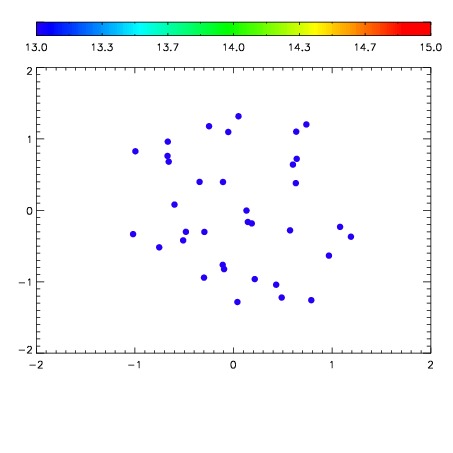

| Frame | Nreads | Zeropoints | Mag plots | Spatial mag deviation | Spatial sky 16325A emission deviations (filled: sky, open: star) | Spatial sky continuum emission | Spatial sky telluric CO2 absorption deviations (filled: H < 10) | |||||||||||||||||||||||
| 0 | 0 |
|
|
|
|
|
|
| IPAIR | NAME | SHIFT | NEWSHIFT | S/N | NAME | SHIFT | NEWSHIFT | S/N |
| 0 | 18440016 | 0.503278 | 0.00000 | 18.4886 | 18440014 | 0.00315924 | 0.500119 | 18.4775 |
| 1 | 18440013 | 0.501819 | 0.00145900 | 18.5803 | 18440015 | 0.00267457 | 0.500603 | 18.7091 |
| 2 | 18440012 | 0.502855 | 0.000423014 | 17.6325 | 18440011 | 0.00000 | 0.503278 | 18.1500 |